BTC/USDT – Bearish Harmonic Formation | Key Levels & Scenarios
Technical Overview:
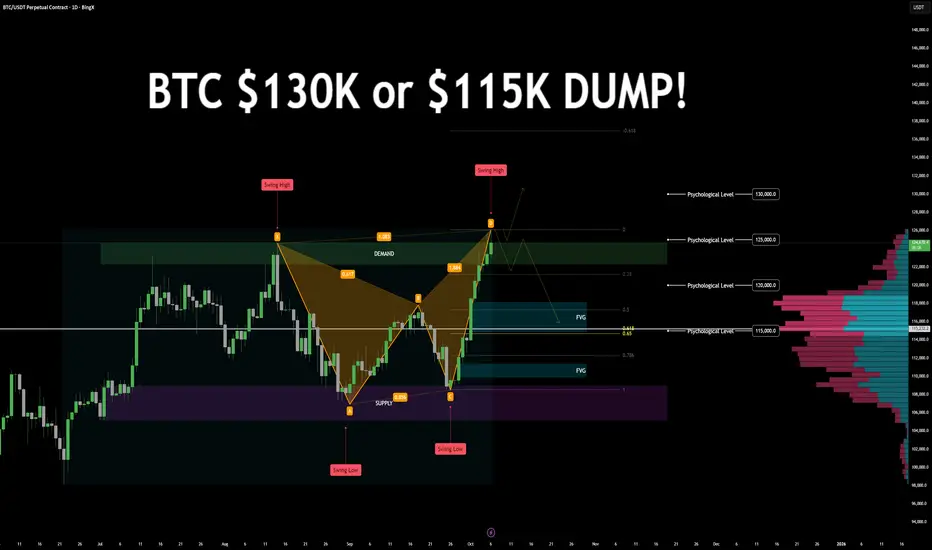
Price is currently forming a bearish harmonic pattern, approaching a key decision zone. The next few daily candles will determine whether BTC continues its bullish trend or initiates a corrective phase.
Key Zones
Demand: 122.2K – 124.7K
Supply: 105.1K – 108.9K
Psychological Levels: 130K · 125K · 120K · 115K
Golden Pocket: Around 115K (0.618–0.65 retracement)
Fair Value Gaps (FVGs):
115K–118K
110K (secondary FVG)
Swing Points:
Previous Swing Low: 108K
Previous Swing High: 126K
High Volume Nodes: 118K and 115K
Market Structure
BTC is respecting a consistent bullish leg with limited pullbacks. Price recently swept the 125K psychological level, aligning with harmonic completion and demand resistance.
Scenario Outlook
🔼 Bullish Continuation:
A daily close above the 124.7K demand zone could invalidate the bearish harmonic and signal continuation toward 130K+ targets.
🔽 Bearish Reversal:
A close below the previous day’s candle low may confirm the start of a bearish correction, targeting 118K → 115K, and potentially 110K.
Bearish Confluences
Bearish Harmonic Pattern completion near key resistance.
Golden Pocket + FVG + Psychological + Volume confluence at 115K.
Extended bullish leg with no significant retracement, followed by 125K liquidity sweep.
LET me know your thoughts below!
Technical Overview:
Price is currently forming a bearish harmonic pattern, approaching a key decision zone. The next few daily candles will determine whether BTC continues its bullish trend or initiates a corrective phase.
Key Zones
Demand: 122.2K – 124.7K
Supply: 105.1K – 108.9K
Psychological Levels: 130K · 125K · 120K · 115K
Golden Pocket: Around 115K (0.618–0.65 retracement)
Fair Value Gaps (FVGs):
115K–118K
110K (secondary FVG)
Swing Points:
Previous Swing Low: 108K
Previous Swing High: 126K
High Volume Nodes: 118K and 115K
Market Structure
BTC is respecting a consistent bullish leg with limited pullbacks. Price recently swept the 125K psychological level, aligning with harmonic completion and demand resistance.
Scenario Outlook
🔼 Bullish Continuation:
A daily close above the 124.7K demand zone could invalidate the bearish harmonic and signal continuation toward 130K+ targets.
🔽 Bearish Reversal:
A close below the previous day’s candle low may confirm the start of a bearish correction, targeting 118K → 115K, and potentially 110K.
Bearish Confluences
Bearish Harmonic Pattern completion near key resistance.
Golden Pocket + FVG + Psychological + Volume confluence at 115K.
Extended bullish leg with no significant retracement, followed by 125K liquidity sweep.
LET me know your thoughts below!
Declinazione di responsabilità
Le informazioni ed i contenuti pubblicati non costituiscono in alcun modo una sollecitazione ad investire o ad operare nei mercati finanziari. Non sono inoltre fornite o supportate da TradingView. Maggiori dettagli nelle Condizioni d'uso.
Declinazione di responsabilità
Le informazioni ed i contenuti pubblicati non costituiscono in alcun modo una sollecitazione ad investire o ad operare nei mercati finanziari. Non sono inoltre fornite o supportate da TradingView. Maggiori dettagli nelle Condizioni d'uso.