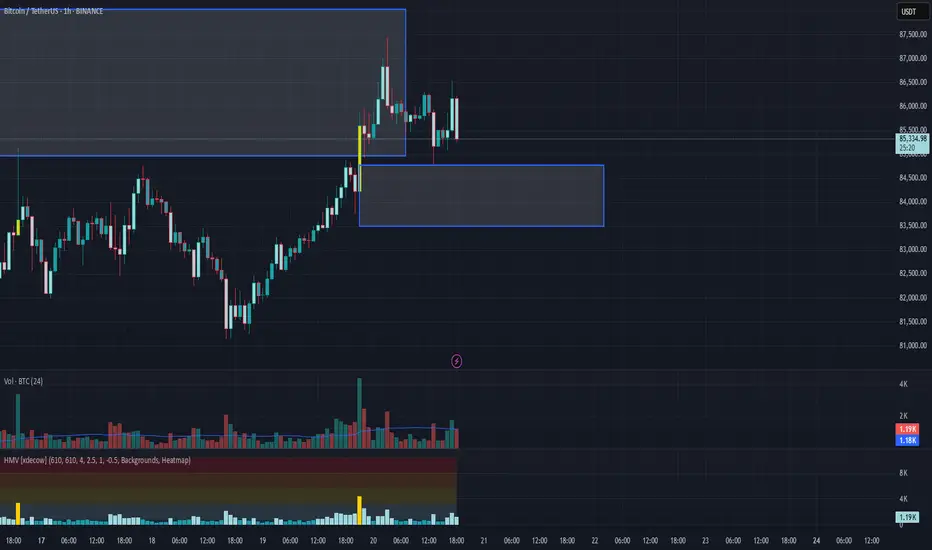
Bitcoin managed to hold above the local range despite seller pressure, tested the key volume zone of $85,000–$88,000, and has already shown an initial selling reaction.
Currently, a local support zone has formed at $84,800–$83,500, casting doubt on the scenario of a decline to the lower boundary. If this zone is tested and buyers react to it, the current uptrend will continue. If there is no reaction, the trend will shift to a bearish direction.
Selling Zones:
$85,000–$88,000 (volume zone)
$95,000–$96,700 (accumulated volumes)
$97,500–$98,400 (pushing volumes)
$107,000–$109,000 (volume anomalies)
Buying Zones:
$84,800–$83,500 (pushing volumes)
$77,000–$73,000 (volume anomalies, pushing volumes)
Unlock your potential in trading
Pubblicazioni correlate
Declinazione di responsabilità
Le informazioni ed i contenuti pubblicati non costituiscono in alcun modo una sollecitazione ad investire o ad operare nei mercati finanziari. Non sono inoltre fornite o supportate da TradingView. Maggiori dettagli nelle Condizioni d'uso.