BTC Technical Analysis (4H Chart):
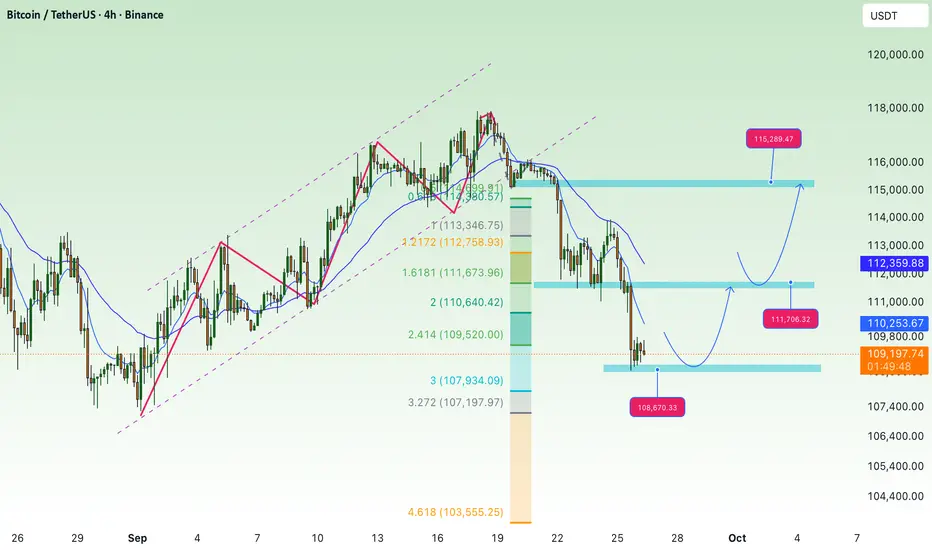
After breaking down from the rising channel, BTC has confirmed a bearish structure, forming lower highs and lower lows.
Price recently bounced from the 108,800–109,000 support zone, which aligns with the 2.618 Fibonacci extension. This is a key short-term support area to watch.
If buyers can hold this support, BTC may retest the 111,600–111,700 resistance zone. A breakout above could open the path toward the higher resistance at 115,300–115,400.
On the downside, if the 109,000 zone fails, the next bearish targets lie at 105,900 and deeper Fibonacci projections around 104,200–103,100.
Trend Outlook:
Short-term: Possible recovery toward 111,600 or even 115,300 if demand holds above 109,000.
Medium-term: Still bearish-biased as long as price stays under the 200 EMA (~114,000).
Key Levels to Note:
Resistance: 111,600 – 111,700, 115,300 – 115,400
Support: 109,000, 105,900, 104,200 – 103,100
Dear My Friends,
NOVA returns and updates new information
✅ Gold Scalping Signal: 4 - 6 signals.
✅ Forex Signal: 5 - 8 signals.
✅ Trading Idea / Setup / Technical.
✅ NEW UPDATE : Signals free in Telegram:
t.me/+1mFSljRaI5RlNjg1
NOVA returns and updates new information
✅ Gold Scalping Signal: 4 - 6 signals.
✅ Forex Signal: 5 - 8 signals.
✅ Trading Idea / Setup / Technical.
✅ NEW UPDATE : Signals free in Telegram:
t.me/+1mFSljRaI5RlNjg1
Pubblicazioni correlate
Declinazione di responsabilità
Le informazioni ed i contenuti pubblicati non costituiscono in alcun modo una sollecitazione ad investire o ad operare nei mercati finanziari. Non sono inoltre fornite o supportate da TradingView. Maggiori dettagli nelle Condizioni d'uso.