BTC Plan Analysis
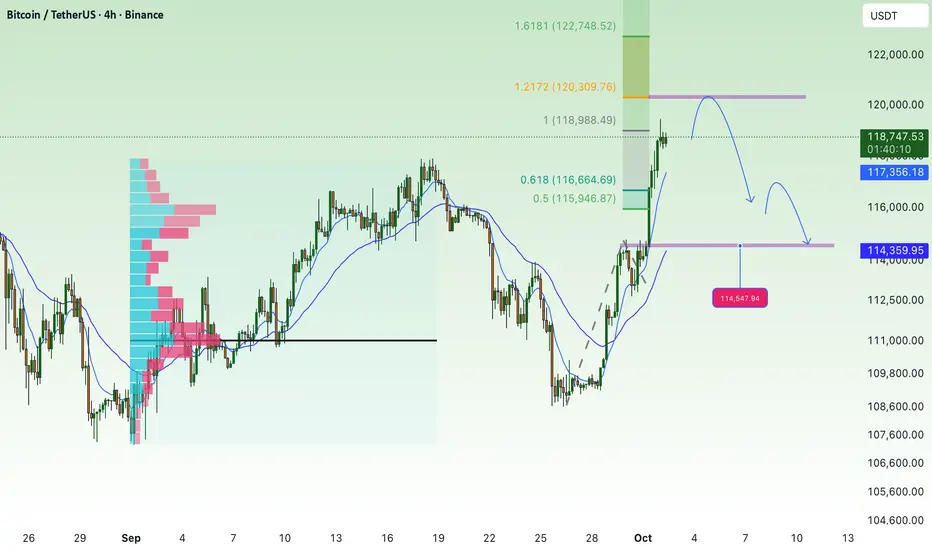
Currently, BTC has rallied strongly toward the 118,700 – 118,800 zone and is testing the 1.0 Fibonacci resistance. This area may trigger short-term profit-taking.
Main outlook: After a sharp rally, the market is likely to see a corrective move.
Key Levels
Resistance:
118,800 – 119,000 (near-term resistance, currently being tested)
120,428 (strong resistance on the higher timeframe)
122,500 (major resistance, extended wave target)
Support:
116,485 (Fibo 0.786, important confluence support)
114,837 (previous resistance turned support + EMA200)
114,150 – 114,050 (lower support, Fibo 0.236)
Possible Scenarios
BTC may face selling pressure at 118,800 – 119,000, leading to a correction back to 116,500.
If 116,500 breaks, the next support zone is 114,800 – 114,000.
If BTC holds above 116,500 and bounces, the market will likely retest the higher resistance at 120,400 – 122,500.
👉 Summary: Price is currently at short-term resistance. It’s better to wait for a reaction before making decisions. The correction toward 116.5K remains the primary scenario before the next clear move.
Dear My Friends,
NOVA returns and updates new information
✅ Gold Scalping Signal: 4 - 6 signals.
✅ Forex Signal: 5 - 8 signals.
✅ Trading Idea / Setup / Technical.
✅ NEW UPDATE : Signals free in Telegram:
t.me/+1mFSljRaI5RlNjg1
NOVA returns and updates new information
✅ Gold Scalping Signal: 4 - 6 signals.
✅ Forex Signal: 5 - 8 signals.
✅ Trading Idea / Setup / Technical.
✅ NEW UPDATE : Signals free in Telegram:
t.me/+1mFSljRaI5RlNjg1
Pubblicazioni correlate
Declinazione di responsabilità
Le informazioni ed i contenuti pubblicati non costituiscono in alcun modo una sollecitazione ad investire o ad operare nei mercati finanziari. Non sono inoltre fornite o supportate da TradingView. Maggiori dettagli nelle Condizioni d'uso.