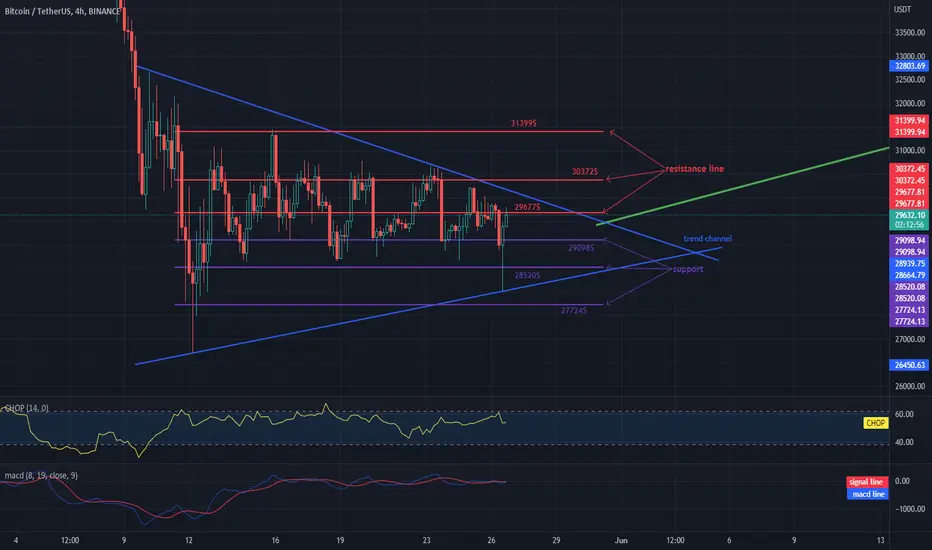
Hello everyone, let's take a look at the BTC to USDT chart over the 4 hour timeframe. As you can see, the price moves sideways in the channel defined by the blue lines.
Despite the fact that today we saw a decline to around $ 28,000, the price quickly returned to around $ 29,600.
Let's start with the designation of the support line and as you can see the first support in the near future is $ 29,098, if the support breaks down, the next one is $ 28,520 and $ 27,724.
Now let's move from the resistance line as you can see the first resistance is $ 29,677 which price is currently struggling with, if it can be broken the next resistance will be $ 30,372 and $ 31,399.
Looking at the CHOP indicator, we can see that we still have a lot of energy in the 4-hour interval, be careful in the hours ahead.
Declinazione di responsabilità
Le informazioni e le pubblicazioni non sono intese come, e non costituiscono, consulenza o raccomandazioni finanziarie, di investimento, di trading o di altro tipo fornite o approvate da TradingView. Per ulteriori informazioni, consultare i Termini di utilizzo.
Declinazione di responsabilità
Le informazioni e le pubblicazioni non sono intese come, e non costituiscono, consulenza o raccomandazioni finanziarie, di investimento, di trading o di altro tipo fornite o approvate da TradingView. Per ulteriori informazioni, consultare i Termini di utilizzo.