As of the close on Monday, May 19, 2025, Central Depository Services (India) Ltd (NSE: CDSL) was trading at ₹1,450.80, marking a 2.98% increase from the previous session.
📊 30-Minute Timeframe Technical Overview
Price Action:
Day's Range: ₹1,408.00 – ₹1,468.00
52-Week Range: ₹1,047.45 – ₹2,989.00
Volume: Approximately 9.5 million shares traded, indicating heightened market activity.
Technical Indicators:
Relative Strength Index (RSI): 69.89 – approaching overbought territory, suggesting caution.
Moving Average Convergence Divergence (MACD): 36.23 – indicating bullish momentum.
Average Directional Index (ADX): 16.44 – suggesting a weak trend strength.
Stochastic Oscillator: 80.92 – in the overbought zone, which may precede a price correction.
Indicator: ₹1,280.03 – acting as a support level.
Parabolic SAR (PSAR): ₹1,209.57 – indicating an upward trend.
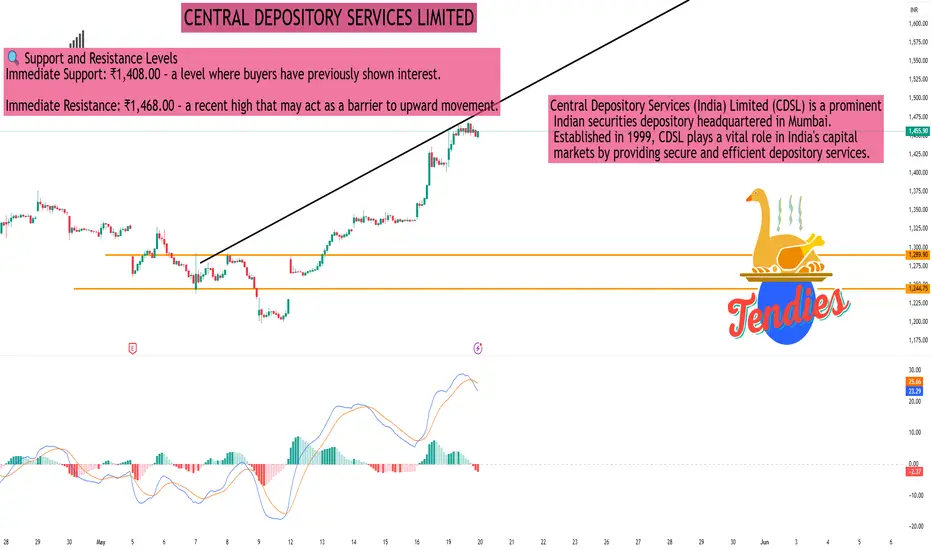
🔍 Support and Resistance Levels
Immediate Support: ₹1,408.00 – a level where buyers have previously shown interest.
Immediate Resistance: ₹1,468.00 – a recent high that may act as a barrier to upward movement.
🔭 Outlook
The technical indicators suggest that CDSL is experiencing a strong bullish trend. However, the RSI and Stochastic Oscillator indicate that the stock is nearing overbought conditions, which could lead to a short-term consolidation or minor correction. Investors should monitor the support and resistance levels closely and consider the heightened trading volume, which may affect the strength of the current trend.
📊 30-Minute Timeframe Technical Overview
Price Action:
Day's Range: ₹1,408.00 – ₹1,468.00
52-Week Range: ₹1,047.45 – ₹2,989.00
Volume: Approximately 9.5 million shares traded, indicating heightened market activity.
Technical Indicators:
Relative Strength Index (RSI): 69.89 – approaching overbought territory, suggesting caution.
Moving Average Convergence Divergence (MACD): 36.23 – indicating bullish momentum.
Average Directional Index (ADX): 16.44 – suggesting a weak trend strength.
Stochastic Oscillator: 80.92 – in the overbought zone, which may precede a price correction.
Indicator: ₹1,280.03 – acting as a support level.
Parabolic SAR (PSAR): ₹1,209.57 – indicating an upward trend.
🔍 Support and Resistance Levels
Immediate Support: ₹1,408.00 – a level where buyers have previously shown interest.
Immediate Resistance: ₹1,468.00 – a recent high that may act as a barrier to upward movement.
🔭 Outlook
The technical indicators suggest that CDSL is experiencing a strong bullish trend. However, the RSI and Stochastic Oscillator indicate that the stock is nearing overbought conditions, which could lead to a short-term consolidation or minor correction. Investors should monitor the support and resistance levels closely and consider the heightened trading volume, which may affect the strength of the current trend.
I built a Buy & Sell Signal Indicator with 85% accuracy.
📈 Get access via DM or
WhatsApp: wa.link/d997q0
| Email: techncialexpress@gmail.com
| Script Coder | Trader | Investor | From India
📈 Get access via DM or
WhatsApp: wa.link/d997q0
| Email: techncialexpress@gmail.com
| Script Coder | Trader | Investor | From India
Pubblicazioni correlate
Declinazione di responsabilità
Le informazioni ed i contenuti pubblicati non costituiscono in alcun modo una sollecitazione ad investire o ad operare nei mercati finanziari. Non sono inoltre fornite o supportate da TradingView. Maggiori dettagli nelle Condizioni d'uso.