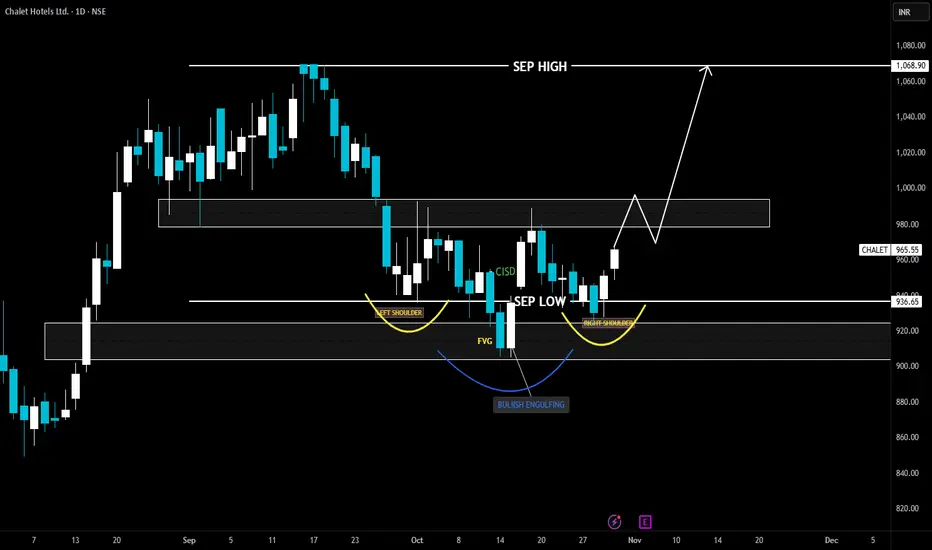
Looking at the chart, it’s pretty clear the stock has been in a short-term downtrend after forming a peak around the September high near ₹1,068, but it has now started to stabilize and show signs of reversal.
We can see a classic inverse head and shoulders pattern forming —
Left Shoulder around early October,
Head near mid-October (the lowest point), and
Right Shoulder forming recently.
At the head, there’s a bullish engulfing candle, which signals strong buying interest and potential reversal. The neckline (resistance turned support) sits roughly around ₹936–940, and the price has broken above it, confirming the bullish structure.
📊 Price Structure & Zones
Support (SEP LOW): ₹936
→ This level held multiple times, showing buyers are active here.
Immediate Resistance / Supply Zone: ₹980–₹995
→ Expect some profit booking or sideways action in this region.
Major Resistance (Target): ₹1,068 (September high)
→ If price sustains above ₹995, it can easily rally toward this zone.
⚙️ Trading Plan
✅ Entry Options
Aggressive Entry:
Around current price (₹960–965) since breakout is confirmed.
Conservative Entry:
Wait for a pullback to ₹940–950 zone and buy on a bullish candle confirmation.
🛡️ Stop-Loss (SL):
Keep SL below ₹925, under the right shoulder / recent swing low.
→ If price falls below this, the pattern fails.
🎯 Targets
Target 1: ₹985–995 (intermediate resistance zone)
Target 2: ₹1,068 (measured move from inverse head & shoulders pattern)
Declinazione di responsabilità
Le informazioni e le pubblicazioni non sono intese come, e non costituiscono, consulenza o raccomandazioni finanziarie, di investimento, di trading o di altro tipo fornite o approvate da TradingView. Per ulteriori informazioni, consultare i Termini di utilizzo.
Declinazione di responsabilità
Le informazioni e le pubblicazioni non sono intese come, e non costituiscono, consulenza o raccomandazioni finanziarie, di investimento, di trading o di altro tipo fornite o approvate da TradingView. Per ulteriori informazioni, consultare i Termini di utilizzo.