🇮🇹 Dojo La Nuit - CHFJPY short H4 (27.11.2025)
📉 CONTESTO DI MERCATO
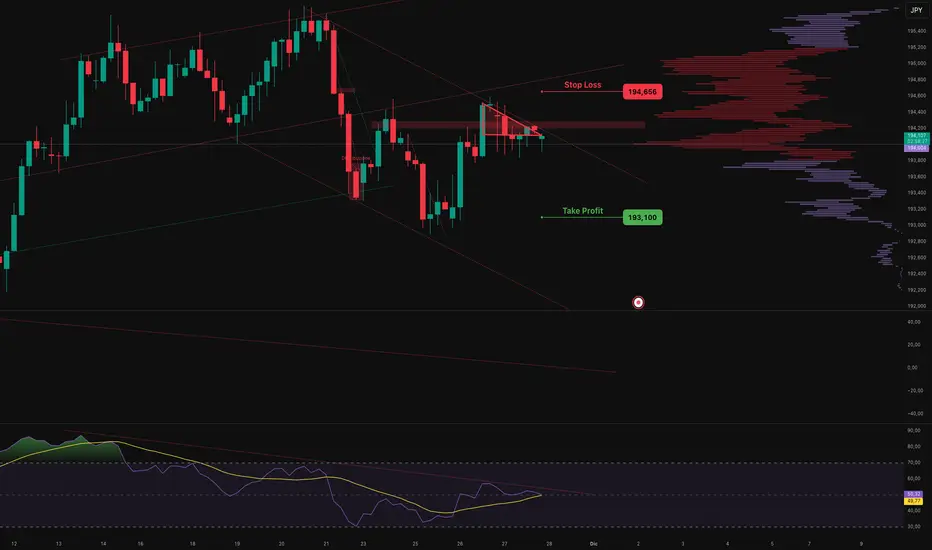
Il franco svizzero contro lo yen giapponese sta quotando a 193.900, e ci troviamo in una configurazione tecnica molto interessante. Il prezzo si trova esattamente sulla resistenza diagonale che ha guidato il movimento ribassista delle ultime settimane, e questo è già un primo segnale importante da non sottovalutare.
Guardando la struttura più nel dettaglio, vedo che si è formato un piccolo triangolo di compressione proprio in questa zona. Questo pattern di consolidamento spesso precede movimenti direzionali significativi, e considerando che ci troviamo contro una resistenza chiave, il bias è chiaramente ribassista.
L'RSI mi sta dando una conferma ulteriore. Sul timeframe H4 vedo che l'indicatore si trova in fase di rimbalzo contro una trendline ribassista, mostrando che il momentum sta perdendo forza proprio mentre il prezzo testa la resistenza. Questa divergenza tra price action e momentum è un segnale classico di possibile inversione.
Il volume profile sul lato destro del chart mostra una buona distribuzione di liquidità verso il basso, con una zona di valore importante intorno ai 193.000, che rappresenta il mio target principale.
🎯 SETUP OPERATIVO
Entro short dall'area attuale a 193.900, sfruttando la confluenza tra resistenza diagonale, pattern triangolare e debolezza RSI. Il mio target è posizionato a 193.100, un livello che non è casuale ma rappresenta un numero psicologico importante arrotondato a cifra tonda, oltre a coincidere con una zona di supporto storico.
Lo stop loss lo piazzo a 194.666, appena sopra la resistenza e il massimo del triangolo, per proteggermi nel caso il prezzo rompa al rialzo invece di scendere come previsto.
Il risk-reward di questo setup è circa 1:1.5, con 76 pips di rischio contro 80 pips di potenziale profitto fino al livello psicologico dei 193.100. Anche se non è un ratio altissimo, la qualità delle confluenze tecniche rende il setup valido dal punto di vista probabilistico.
📊 GESTIONE E SCENARI
La mia gestione sarà attiva e basata sulla price action. Al raggiungimento del target a 193.100, chiuderò sicuramente una parte della posizione per bloccare profitto, dato che questo livello psicologico potrebbe generare una reazione di rimbalzo.
Se il prezzo rompe nettamente sotto 193.100 e continua la discesa con volume, terrò aperta una porzione della posizione puntando all'area 192.600-192.800 dove vedo un'altra zona di supporto interessante sul volume profile. In questo scenario, sposterò lo stop in breakeven per eliminare il rischio.
Nel caso invece il prezzo non scenda ma rompa al rialzo sopra lo stop a 194.666, accetterò la perdita e rivaluterò. Una rottura della resistenza diagonale con volume cambierebbe completamente lo scenario tecnico e aprirebbe spazio per un movimento rialzista più ampio.
La chiave di questo trade è la pazienza. Il triangolo deve risolvere, e la mia aspettativa è che lo faccia al ribasso considerando tutte le confluenze ribassiste presenti.
📈 LOGICA DELL'ANALISI
Questo setup si basa sulla convergenza di tre elementi tecnici fondamentali che raramente si allineano tutti insieme. Primo, abbiamo la resistenza diagonale che sta fungendo da copertura per il prezzo. Secondo, il pattern triangolare mostra una compressione della volatilità che precede tipicamente un movimento direzionale. Terzo, l'RSI in rimbalzo contro trendline ribassista conferma la perdita di momentum rialzista.
Quando questi tre elementi si presentano contemporaneamente, la probabilità di un movimento ribassista aumenta significativamente. Il fatto che il target a 193.100 sia un livello psicologico arrotondato mi dà ulteriore fiducia, perché so che molti trader metteranno ordini proprio in quella zona, creando naturalmente supporto e potenziale reazione.
La gestione attiva al target sarà fondamentale. Non è un trade da "set and forget", ma richiede attenzione per massimizzare il profitto o proteggere il capitale a seconda di come il mercato reagirà.
────────────────────────────────────────────────────────────────
🇺🇸 Dojo La Nuit - CHFJPY short H4 (27.11.2025)
📉 MARKET CONTEXT
The Swiss franc against the Japanese yen is trading at 193.900, and we're seeing a very interesting technical configuration here. Price is sitting exactly on the diagonal resistance that has guided the bearish movement over the past weeks, and this is already an important first signal we shouldn't overlook.
Looking at the structure in more detail, I can see a small triangle compression pattern has formed right in this zone. This consolidation pattern often precedes significant directional moves, and considering we're against a key resistance, the bias is clearly bearish.
The RSI is giving me additional confirmation. On the H4 timeframe I see the indicator is bouncing against a bearish trendline, showing that momentum is losing strength precisely while price tests resistance. This divergence between price action and momentum is a classic signal of possible reversal.
The volume profile on the right side of the chart shows good liquidity distribution towards the downside, with an important value zone around 193.000, which represents my primary target.
🎯 TRADE SETUP
I'm entering short from the current area at 193.900, exploiting the confluence between diagonal resistance, triangle pattern, and RSI weakness. My target is positioned at 193.100, a level that's not random but represents an important psychological round number, as well as coinciding with a historical support zone.
I'm placing the stop loss at 194.666, just above the resistance and the triangle high, to protect myself in case price breaks upward instead of dropping as expected.
The risk-reward of this setup is approximately 1:1.5, with 76 pips of risk against 80 pips of potential profit to the psychological level of 193.100. Although it's not a very high ratio, the quality of technical confluences makes the setup valid from a probabilistic standpoint.
📊 MANAGEMENT AND SCENARIOS
My management will be active and based on price action. Upon reaching the target at 193.100, I'll definitely close part of the position to lock in profit, since this psychological level could generate a bounce reaction.
If price breaks cleanly below 193.100 and continues the descent with volume, I'll keep a portion of the position open aiming for the 192.600-192.800 area where I see another interesting support zone on the volume profile. In this scenario, I'll move the stop to breakeven to eliminate risk.
In case price doesn't drop but breaks upward above the stop at 194.666, I'll accept the loss and reassess. A break of the diagonal resistance with volume would completely change the technical scenario and open space for a broader bullish movement.
The key to this trade is patience. The triangle needs to resolve, and my expectation is it will do so to the downside considering all the bearish confluences present.
📈 ANALYSIS LOGIC
This setup is based on the convergence of three fundamental technical elements that rarely align all together. First, we have the diagonal resistance acting as a ceiling for price. Second, the triangle pattern shows a compression of volatility that typically precedes a directional movement. Third, the RSI bouncing against a bearish trendline confirms the loss of bullish momentum.
When these three elements present themselves simultaneously, the probability of a bearish movement increases significantly. The fact that the target at 193.100 is a rounded psychological level gives me additional confidence, because I know many traders will place orders right in that zone, naturally creating support and potential reaction.
Active management at the target will be fundamental. This isn't a "set and forget" trade, but requires attention to maximize profit or protect capital depending on how the market reacts.
────────────────────────────────────────────────────────────────
📉 CONTESTO DI MERCATO
Il franco svizzero contro lo yen giapponese sta quotando a 193.900, e ci troviamo in una configurazione tecnica molto interessante. Il prezzo si trova esattamente sulla resistenza diagonale che ha guidato il movimento ribassista delle ultime settimane, e questo è già un primo segnale importante da non sottovalutare.
Guardando la struttura più nel dettaglio, vedo che si è formato un piccolo triangolo di compressione proprio in questa zona. Questo pattern di consolidamento spesso precede movimenti direzionali significativi, e considerando che ci troviamo contro una resistenza chiave, il bias è chiaramente ribassista.
L'RSI mi sta dando una conferma ulteriore. Sul timeframe H4 vedo che l'indicatore si trova in fase di rimbalzo contro una trendline ribassista, mostrando che il momentum sta perdendo forza proprio mentre il prezzo testa la resistenza. Questa divergenza tra price action e momentum è un segnale classico di possibile inversione.
Il volume profile sul lato destro del chart mostra una buona distribuzione di liquidità verso il basso, con una zona di valore importante intorno ai 193.000, che rappresenta il mio target principale.
🎯 SETUP OPERATIVO
Entro short dall'area attuale a 193.900, sfruttando la confluenza tra resistenza diagonale, pattern triangolare e debolezza RSI. Il mio target è posizionato a 193.100, un livello che non è casuale ma rappresenta un numero psicologico importante arrotondato a cifra tonda, oltre a coincidere con una zona di supporto storico.
Lo stop loss lo piazzo a 194.666, appena sopra la resistenza e il massimo del triangolo, per proteggermi nel caso il prezzo rompa al rialzo invece di scendere come previsto.
Il risk-reward di questo setup è circa 1:1.5, con 76 pips di rischio contro 80 pips di potenziale profitto fino al livello psicologico dei 193.100. Anche se non è un ratio altissimo, la qualità delle confluenze tecniche rende il setup valido dal punto di vista probabilistico.
📊 GESTIONE E SCENARI
La mia gestione sarà attiva e basata sulla price action. Al raggiungimento del target a 193.100, chiuderò sicuramente una parte della posizione per bloccare profitto, dato che questo livello psicologico potrebbe generare una reazione di rimbalzo.
Se il prezzo rompe nettamente sotto 193.100 e continua la discesa con volume, terrò aperta una porzione della posizione puntando all'area 192.600-192.800 dove vedo un'altra zona di supporto interessante sul volume profile. In questo scenario, sposterò lo stop in breakeven per eliminare il rischio.
Nel caso invece il prezzo non scenda ma rompa al rialzo sopra lo stop a 194.666, accetterò la perdita e rivaluterò. Una rottura della resistenza diagonale con volume cambierebbe completamente lo scenario tecnico e aprirebbe spazio per un movimento rialzista più ampio.
La chiave di questo trade è la pazienza. Il triangolo deve risolvere, e la mia aspettativa è che lo faccia al ribasso considerando tutte le confluenze ribassiste presenti.
📈 LOGICA DELL'ANALISI
Questo setup si basa sulla convergenza di tre elementi tecnici fondamentali che raramente si allineano tutti insieme. Primo, abbiamo la resistenza diagonale che sta fungendo da copertura per il prezzo. Secondo, il pattern triangolare mostra una compressione della volatilità che precede tipicamente un movimento direzionale. Terzo, l'RSI in rimbalzo contro trendline ribassista conferma la perdita di momentum rialzista.
Quando questi tre elementi si presentano contemporaneamente, la probabilità di un movimento ribassista aumenta significativamente. Il fatto che il target a 193.100 sia un livello psicologico arrotondato mi dà ulteriore fiducia, perché so che molti trader metteranno ordini proprio in quella zona, creando naturalmente supporto e potenziale reazione.
La gestione attiva al target sarà fondamentale. Non è un trade da "set and forget", ma richiede attenzione per massimizzare il profitto o proteggere il capitale a seconda di come il mercato reagirà.
────────────────────────────────────────────────────────────────
🇺🇸 Dojo La Nuit - CHFJPY short H4 (27.11.2025)
📉 MARKET CONTEXT
The Swiss franc against the Japanese yen is trading at 193.900, and we're seeing a very interesting technical configuration here. Price is sitting exactly on the diagonal resistance that has guided the bearish movement over the past weeks, and this is already an important first signal we shouldn't overlook.
Looking at the structure in more detail, I can see a small triangle compression pattern has formed right in this zone. This consolidation pattern often precedes significant directional moves, and considering we're against a key resistance, the bias is clearly bearish.
The RSI is giving me additional confirmation. On the H4 timeframe I see the indicator is bouncing against a bearish trendline, showing that momentum is losing strength precisely while price tests resistance. This divergence between price action and momentum is a classic signal of possible reversal.
The volume profile on the right side of the chart shows good liquidity distribution towards the downside, with an important value zone around 193.000, which represents my primary target.
🎯 TRADE SETUP
I'm entering short from the current area at 193.900, exploiting the confluence between diagonal resistance, triangle pattern, and RSI weakness. My target is positioned at 193.100, a level that's not random but represents an important psychological round number, as well as coinciding with a historical support zone.
I'm placing the stop loss at 194.666, just above the resistance and the triangle high, to protect myself in case price breaks upward instead of dropping as expected.
The risk-reward of this setup is approximately 1:1.5, with 76 pips of risk against 80 pips of potential profit to the psychological level of 193.100. Although it's not a very high ratio, the quality of technical confluences makes the setup valid from a probabilistic standpoint.
📊 MANAGEMENT AND SCENARIOS
My management will be active and based on price action. Upon reaching the target at 193.100, I'll definitely close part of the position to lock in profit, since this psychological level could generate a bounce reaction.
If price breaks cleanly below 193.100 and continues the descent with volume, I'll keep a portion of the position open aiming for the 192.600-192.800 area where I see another interesting support zone on the volume profile. In this scenario, I'll move the stop to breakeven to eliminate risk.
In case price doesn't drop but breaks upward above the stop at 194.666, I'll accept the loss and reassess. A break of the diagonal resistance with volume would completely change the technical scenario and open space for a broader bullish movement.
The key to this trade is patience. The triangle needs to resolve, and my expectation is it will do so to the downside considering all the bearish confluences present.
📈 ANALYSIS LOGIC
This setup is based on the convergence of three fundamental technical elements that rarely align all together. First, we have the diagonal resistance acting as a ceiling for price. Second, the triangle pattern shows a compression of volatility that typically precedes a directional movement. Third, the RSI bouncing against a bearish trendline confirms the loss of bullish momentum.
When these three elements present themselves simultaneously, the probability of a bearish movement increases significantly. The fact that the target at 193.100 is a rounded psychological level gives me additional confidence, because I know many traders will place orders right in that zone, naturally creating support and potential reaction.
Active management at the target will be fundamental. This isn't a "set and forget" trade, but requires attention to maximize profit or protect capital depending on how the market reacts.
────────────────────────────────────────────────────────────────
Declinazione di responsabilità
Le informazioni e le pubblicazioni non sono intese come, e non costituiscono, consulenza o raccomandazioni finanziarie, di investimento, di trading o di altro tipo fornite o approvate da TradingView. Per ulteriori informazioni, consultare i Termini di utilizzo.
Declinazione di responsabilità
Le informazioni e le pubblicazioni non sono intese come, e non costituiscono, consulenza o raccomandazioni finanziarie, di investimento, di trading o di altro tipo fornite o approvate da TradingView. Per ulteriori informazioni, consultare i Termini di utilizzo.