📈 Weekly Support & Resistance Levels
Support Levels:
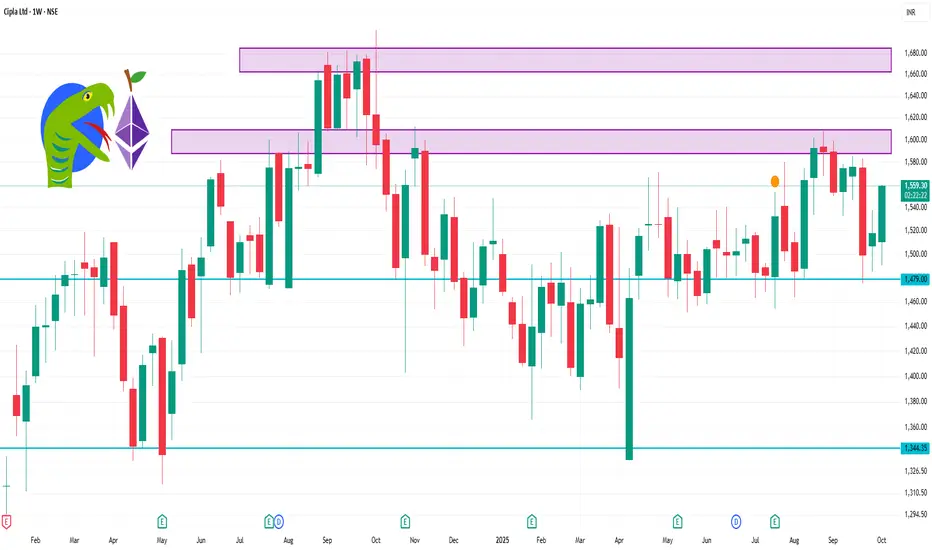
S1: ₹1,491.53
S2: ₹1,499.17
S3: ₹1,506.48
S4: ₹1,514.12
Resistance Levels:
R1: ₹1,521.43
R2: ₹1,529.07
R3: ₹1,536.38
R4: ₹1,544.70
These levels are derived from the classic pivot point method and can serve as potential entry or exit points for traders.
Technical Indicators Snapshot
Relative Strength Index (RSI): 77.43 (approaching overbought territory)
MACD: 7.01 (bullish crossover)
Average Directional Index (ADX): 30.49 (indicating a strong trend)
Commodity Channel Index (CCI): 307.2 (overbought)
Williams %R: -0.79 (overbought)
Rate of Change (ROC): 3.81% (bullish momentum)
Moving Averages:
5-day: ₹1,527.76
50-day: ₹1,510.91
200-day: ₹1,542.76
Support Levels:
S1: ₹1,491.53
S2: ₹1,499.17
S3: ₹1,506.48
S4: ₹1,514.12
Resistance Levels:
R1: ₹1,521.43
R2: ₹1,529.07
R3: ₹1,536.38
R4: ₹1,544.70
These levels are derived from the classic pivot point method and can serve as potential entry or exit points for traders.
Technical Indicators Snapshot
Relative Strength Index (RSI): 77.43 (approaching overbought territory)
MACD: 7.01 (bullish crossover)
Average Directional Index (ADX): 30.49 (indicating a strong trend)
Commodity Channel Index (CCI): 307.2 (overbought)
Williams %R: -0.79 (overbought)
Rate of Change (ROC): 3.81% (bullish momentum)
Moving Averages:
5-day: ₹1,527.76
50-day: ₹1,510.91
200-day: ₹1,542.76
Pubblicazioni correlate
Declinazione di responsabilità
Le informazioni e le pubblicazioni non sono intese come, e non costituiscono, consulenza o raccomandazioni finanziarie, di investimento, di trading o di altro tipo fornite o approvate da TradingView. Per ulteriori informazioni, consultare i Termini di utilizzo.