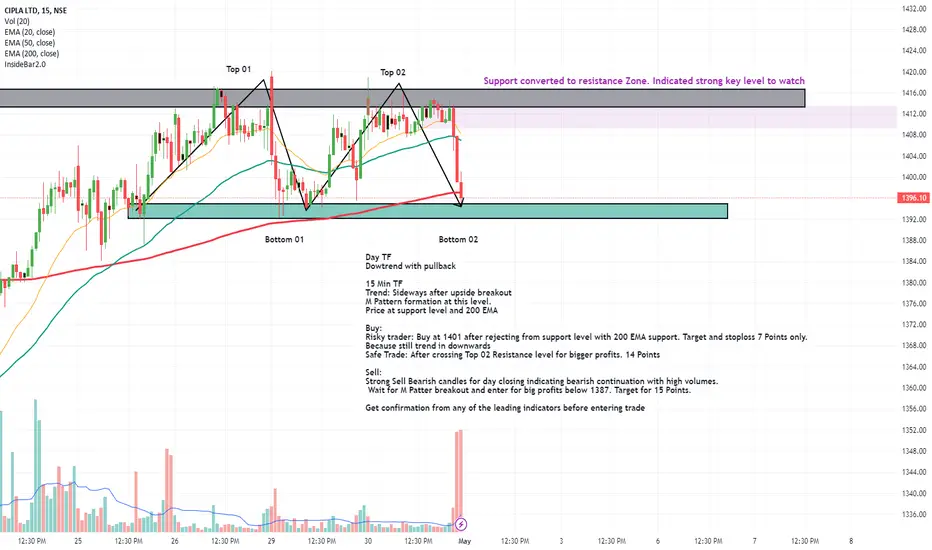
Day TF
Dowtrend with pullback
15 Min TF
Trend: Sideways after upside breakout
M Pattern formation at this level.
Price at support level and 200 EMA
Buy:
Risky trader: Buy at 1401 after rejecting from support level with 200 EMA support. Target and stoploss 7 Points only.
Because still trend in downwards
Safe Trade: After crossing Top 02 Resistance level for bigger profits. 14 Points
Sell:
Strong Sell Bearish candles for day closing indicating bearish continuation with high volumes.
Wait for M Patter breakout and enter for big profits below 1387. Target for 15 Points.
Get confirmation from any of the leading indicators before entering trade
Trade chiuso: obiettivo raggiunto
Target Achieved for both Risky and safe traders. Still there is lot of bullish signs to move further above 1425Declinazione di responsabilità
Le informazioni ed i contenuti pubblicati non costituiscono in alcun modo una sollecitazione ad investire o ad operare nei mercati finanziari. Non sono inoltre fornite o supportate da TradingView. Maggiori dettagli nelle Condizioni d'uso.
Declinazione di responsabilità
Le informazioni ed i contenuti pubblicati non costituiscono in alcun modo una sollecitazione ad investire o ad operare nei mercati finanziari. Non sono inoltre fornite o supportate da TradingView. Maggiori dettagli nelle Condizioni d'uso.