1. Company Overview
If Q2 FY 2025–26 results come positive, the stock may move toward:
- Dabur India Ltd is one of India’s leading FMCG companies with deep roots in Ayurveda and natural healthcare.
- It operates across Home Care, Personal Care, Healthcare, and Foods, serving both domestic and international markets.
- The company’s ongoing strategy focuses on rural distribution expansion, premiumisation of products, and margin improvement through operational efficiency and cost control.
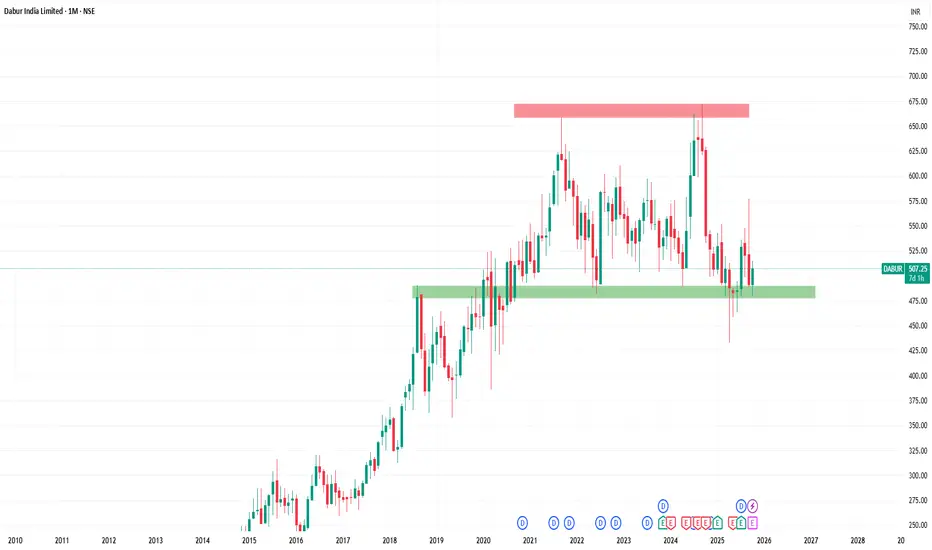
- On the monthly timeframe, Dabur’s long-term trend shows a strong up-move — from below ₹10 in 2001 to an all-time high of ₹658 in 2021.
- Since 2021, the ₹658–₹672 zone has acted as a major resistance, while the ₹470–₹490 zone has consistently provided strong support.
- The same zone, which acted as resistance in 2018, has now turned into a demand zone.
- Currently, the stock is trading around ₹511, exactly near the support region and showing signs of reversal from the demand zone.
If Q2 FY 2025–26 results come positive, the stock may move toward:
- 1st Target: ₹550
- 2nd Target: ₹600
- 3rd Target: ₹650
- However, if this zone fails to sustain, there should be no further expectations, as the maximum swing low lies near ₹430.
- This gives a clear roadmap for both upside potential and downside risk.
- Revenue (FY 2024–25): ₹ 12,563 crore vs ₹ 12,404 crore in FY 2023–24 (+1.3% YoY)
- Net Profit (FY 2024–25): ₹ 1,740 crore vs ₹ 1,811 crore in FY 2023–24 (–3.9% YoY)
- Revenue growth remained modest, while profit declined slightly due to margin pressures and cost factors.
- Q1 FY 2025–26: Reported steady performance with stable volumes and controlled expenses.
- Q2 FY 2025–26: Yet to be declared — this quarter will be crucial in deciding near-term price direction.
- Debt Levels: Long-term borrowings have continued to decline, reflecting financial discipline and improved leverage.
- Valuation: Dabur trades at a moderate premium to the FMCG sector average due to its strong brand portfolio and steady financial track record.
- RSI (14): ~63 — showing underlying strength, not overbought.
- MACD: In buy mode, supporting short-term bullish sentiment.
- Moving Averages:
- MA 50 – ₹ 495
- MA 100 – ₹ 492
- MA 200 – ₹ 510 (currently acting as short-term resistance)
- Support Zone: ₹ 470 – ₹ 490
- Resistance Zone: ₹ 658 – ₹ 672
- Technically, the stock is taking support at a strong demand zone with clear upside potential if the next results are favorable.
- Fundamentally, Dabur remains financially stable with a robust brand base and controlled debt.
- A positive Q2 FY 2025–26 can act as a catalyst for a rally toward ₹ 550 / ₹ 600 / ₹ 650, whereas a break below ₹ 470 may extend the fall toward ₹ 430.
- Dabur India stands as a fundamentally strong and technically interesting setup within the FMCG space.
- The stock is trading near a long-term support zone, offering a good risk–reward setup for investors.
- If Q2 FY 2025–26 results are strong, the stock may begin a fresh upward leg toward ₹ 650 levels.
- Conversely, if the stock breaks below ₹ 470, the trend may remain weak toward the ₹ 430 zone.
- For long-term investors, this zone offers a strategic accumulation opportunity backed by stability, strong distribution, and consistent brand power.
Declinazione di responsabilità
Le informazioni e le pubblicazioni non sono intese come, e non costituiscono, consulenza o raccomandazioni finanziarie, di investimento, di trading o di altro tipo fornite o approvate da TradingView. Per ulteriori informazioni, consultare i Termini di utilizzo.
Declinazione di responsabilità
Le informazioni e le pubblicazioni non sono intese come, e non costituiscono, consulenza o raccomandazioni finanziarie, di investimento, di trading o di altro tipo fornite o approvate da TradingView. Per ulteriori informazioni, consultare i Termini di utilizzo.