Use this as a guide to develop your view of the situation.
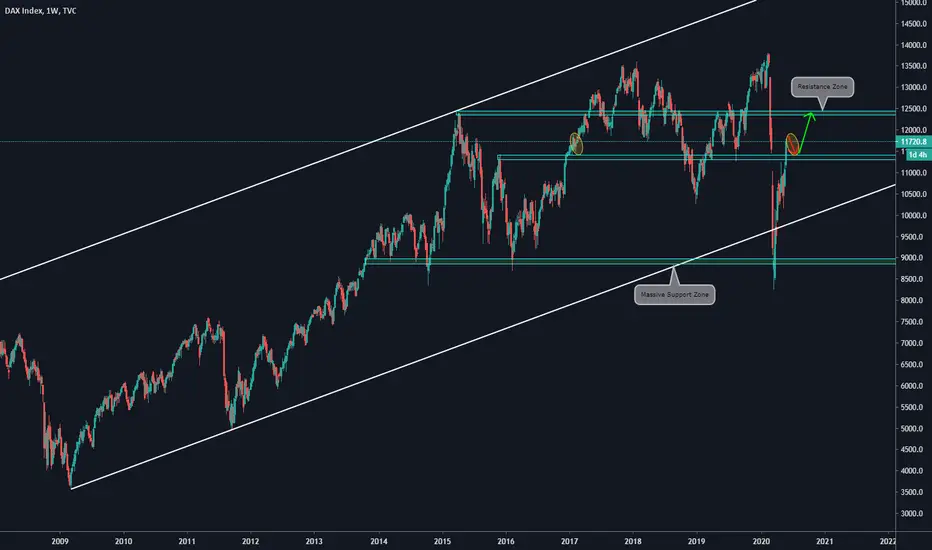
Main items we can see on the Weekly Chart:
a)The price broke with a bullish movement a previous Resistance Zone
b)Taking a look into the past, we can see a similar bullish movement than the current one
c)Using it as something to copy, we will wait for a correction on the current area
d)After that, we will set a long trade towards 12350
e)Of course, we will develop our setup on a lower timeframe, such as 4hs /1h. Use this chart as an idea of how long you should wait before the movement.
Declinazione di responsabilità
Le informazioni ed i contenuti pubblicati non costituiscono in alcun modo una sollecitazione ad investire o ad operare nei mercati finanziari. Non sono inoltre fornite o supportate da TradingView. Maggiori dettagli nelle Condizioni d'uso.
Declinazione di responsabilità
Le informazioni ed i contenuti pubblicati non costituiscono in alcun modo una sollecitazione ad investire o ad operare nei mercati finanziari. Non sono inoltre fornite o supportate da TradingView. Maggiori dettagli nelle Condizioni d'uso.