📈Technical Analysis
Dixon Technologies Ltd has shown a strong long-term uptrend since 2018, following a consistent Buy-on-Dips structure. The stock hit its All-Time High in Dec 2024, post which it corrected nearly 36%, forming a series of Lower Highs.
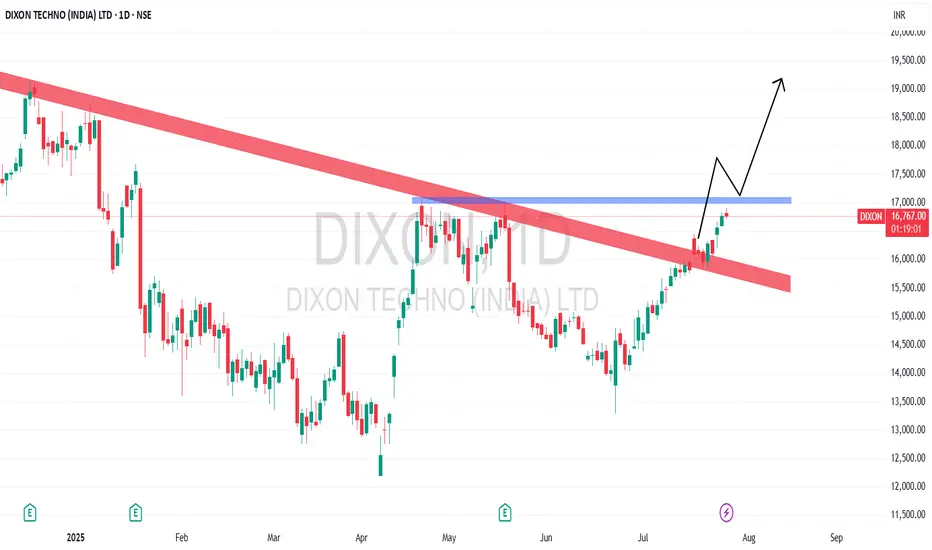
Currently, it's trading at ₹16,556, and today it broke the most recent Lower High, indicating a potential trend reversal. Interestingly, this technical breakout aligns with strong Q4 results, further supporting bullish sentiment.
The next key resistance lies at ₹17,000 – an earlier lower high. A breakout above this level, followed by a bullish retest, could pave the way for a fresh rally.
🎯Upside Targets:
🎯Target 1: ₹17,500
🎯Target 2: ₹18,000
🎯Target 3: ₹18,500
🛡️Key Support Levels:
₹14,000 (Minor Support)
₹12,000 (Major Demand Zone)
If these supports fail, the bullish structure may be invalidated.
💰FY24 Financial Performance (vs FY23 & FY22)
Dixon Technologies Ltd has shown a strong long-term uptrend since 2018, following a consistent Buy-on-Dips structure. The stock hit its All-Time High in Dec 2024, post which it corrected nearly 36%, forming a series of Lower Highs.
Currently, it's trading at ₹16,556, and today it broke the most recent Lower High, indicating a potential trend reversal. Interestingly, this technical breakout aligns with strong Q4 results, further supporting bullish sentiment.
The next key resistance lies at ₹17,000 – an earlier lower high. A breakout above this level, followed by a bullish retest, could pave the way for a fresh rally.
🎯Upside Targets:
🎯Target 1: ₹17,500
🎯Target 2: ₹18,000
🎯Target 3: ₹18,500
🛡️Key Support Levels:
₹14,000 (Minor Support)
₹12,000 (Major Demand Zone)
If these supports fail, the bullish structure may be invalidated.
💰FY24 Financial Performance (vs FY23 & FY22)
- Total Income: ₹38,860 Cr (↑ +120% vs ₹17,691 Cr; ↑ +219% vs ₹12,192 Cr)
- Total Expenses: ₹37,353 Cr (↑ +120% vs ₹16,988 Cr; ↑ +215% vs ₹11,873 Cr)
- Financing Profit: ₹1,508 Cr (↑ +114% vs ₹705 Cr; ↑ +190% vs ₹519 Cr)
- Profit Before Tax: ₹1,570 Cr (↑ +218% vs ₹494 Cr; ↑ +355% vs ₹345 Cr)
- Profit After Tax: ₹1,233 Cr (↑ +228% vs ₹375 Cr; ↑ +384% vs ₹255 Cr)
- EPS: ₹181.87 (↑ +196% vs ₹61.47; ↑ +325% vs ₹42.90)
📌Exceptional growth across all metrics indicates robust demand, streamlined costs, and successful scaling.
🔍Fundamental StrengthsCAGR & Profitability: 45%+ revenue CAGR over 5 years, with ROE ~28%
FY25 Estimates: Revenue at ₹38,860 Cr (+120%) and PAT at ₹1,100 Cr (+198%)
Q4 Highlights: PAT jumped 322% YoY to ₹401 Cr on a 121% surge in revenue to ₹10,293 Cr
Financial Discipline: Minimal debt (total debt/ equity ~0.07), strong cash flows, and high asset turnover
Operational Scale: 17 manufacturing units; JV with Vivo in Dec 2024 indicates strategy expansion
✅Conclusion
Dixon is showing a compelling technical breakout, backed by outstanding FY24 and Q4 results. Uptick above ₹17,000 with solid support suggests continuation toward ₹18,500. Strong fundamentals reinforce medium‑term potential, but critical stops at ₹14,000 and ₹12,000 should be respected.
Disclaimer:lnkd.in/gJJDnvn2
Declinazione di responsabilità
Le informazioni ed i contenuti pubblicati non costituiscono in alcun modo una sollecitazione ad investire o ad operare nei mercati finanziari. Non sono inoltre fornite o supportate da TradingView. Maggiori dettagli nelle Condizioni d'uso.
Declinazione di responsabilità
Le informazioni ed i contenuti pubblicati non costituiscono in alcun modo una sollecitazione ad investire o ad operare nei mercati finanziari. Non sono inoltre fornite o supportate da TradingView. Maggiori dettagli nelle Condizioni d'uso.