Timeframe: 30-Minute
Chart: Wall Street Index (US30)
Source: TradingView
________________________________________
🔍 Overview
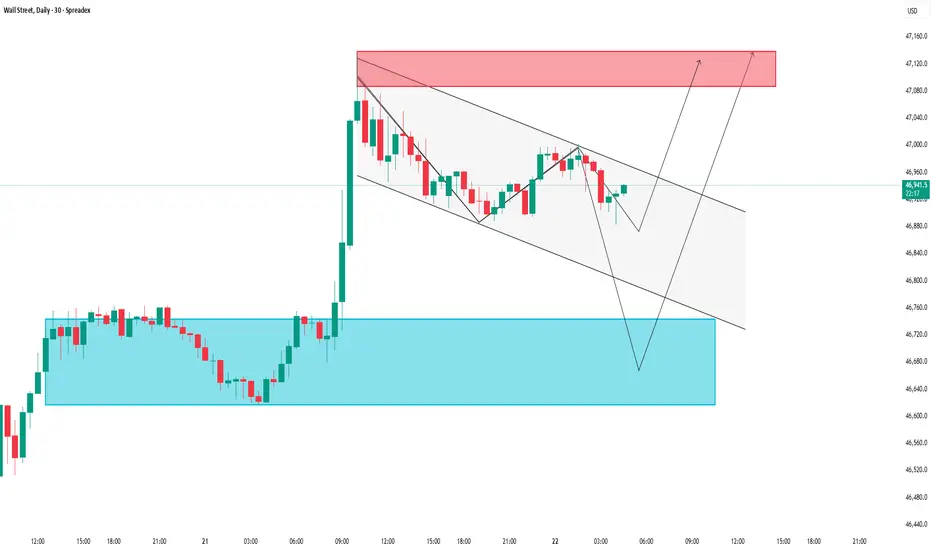
In this Wall Street index analysis, the US30 is currently consolidating within a descending price channel after a sharp bullish breakout from a key demand zone. The chart outlines potential price action scenarios based on key support and resistance levels derived from supply and demand dynamics.
________________________________________
Key Supply & Demand Zones
🔵 Demand Zone (Support Area): 46,660 – 46,720 USD
This is the deep support zone where price previously reversed sharply. It represents a high-probability buying area if retested.
🟢 Short-Term Support / Accumulation Zone: 46,880 – 46,950 USD
Price has shown multiple reactions here, indicating accumulation and temporary demand. A break below this area could lead to a move toward the lower demand zone.
🔴 Supply Zone (Resistance Area): 47,100 – 47,160 USD
This is a potential reversal zone where sellers may become active again. A breakout above this area could signal continuation of the bullish trend.
________________________________________
🧭 Technical Structure & Price Action Scenarios
The chart shows two main forecast scenarios for US30:
📉 Scenario 1: Bearish Pullback to the Lower Demand Zone
• Price gets rejected at the upper boundary of the descending channel.
• If bearish momentum continues, expect a decline toward the 46,660 – 46,720 USD zone.
• Look for bullish reversal signals such as a hammer or bullish engulfing candle before considering long positions.
📈 Scenario 2: Bullish Breakout Toward the Supply Zone
• If price sustains above 46,950 USD and breaks the descending trendline, a bullish move may be confirmed.
• Target zone: 47,100 – 47,160 USD.
• A successful breakout here could open up a continuation toward higher levels.
________________________________________
📌 Supporting Indicators
• Parabolic SAR: Dots are showing a potential shift during the retracement. Watch for dots flipping below price to support bullish continuation.
• Breakout Confirmation: The previous breakout above the 46,880 range adds weight to the current bullish outlook.
________________________________________
✅ Trading Setup Summary
Scenario Key Zone Action
📉 Pullback 46,660 – 46,720 Watch for long entry (support test)
📈 Breakout 46,950 Long toward 47,100 – 47,160
• Support Holding Above: 46,880 – 46,950 USD
• Resistance Zone to Watch: 47,100 – 47,160 USD
________________________________________
⚠️ Final Thoughts
The current structure indicates a pullback within a broader bullish context. Watch how price reacts at support zones and the descending channel. Traders should wait for clear confirmation before entering positions and maintain strict risk management.
📈 This setup is suitable for day traders and short-term swing traders looking to trade the US30 index based on clean price action and supply & demand logic.
Please like and comment below to support our traders. Your reactions will motivate us to do more analysis in the future 🙏✨
Harry Andrew @ ZuperView
Declinazione di responsabilità
Le informazioni e le pubblicazioni non sono intese come, e non costituiscono, consulenza o raccomandazioni finanziarie, di investimento, di trading o di altro tipo fornite o approvate da TradingView. Per ulteriori informazioni, consultare i Termini di utilizzo.
Declinazione di responsabilità
Le informazioni e le pubblicazioni non sono intese come, e non costituiscono, consulenza o raccomandazioni finanziarie, di investimento, di trading o di altro tipo fornite o approvate da TradingView. Per ulteriori informazioni, consultare i Termini di utilizzo.