After an extended bullish duration, the DXY is now challenging a technically critical “Supply Zone” (100.150 – 100.600). Further away from key levels, both pump and dump up and down, momentum oscillators on all time frames give us mixed signals of exhaustion from buyers and that we are near to making a big decision in the direction of our market.
A comprehensive technical look that includes the broader structures and multi-month macroeconomic supply-demand analysis.
TECHNICAL OUTLOOK
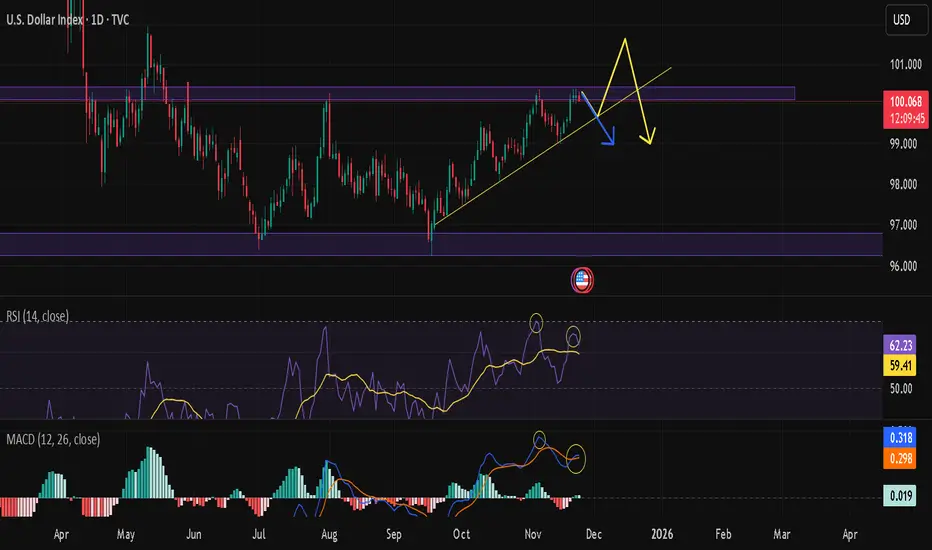
Critical Resistance (Purple Zone): We are currently sitting right inside that 100.150 – 100.600 corridor. This is a level we know well—it’s packed with strong selling pressure and smart money order blocks. Think of this zone as a huge mental hurdle for the bulls; trying to go "Long" here without seeing a clean, high-volume breakout is just asking for trouble with a bad risk/reward setup.
Trend Structure: That ascending yellow trendline connecting the lows since September has been holding the price up so far. But look closer—the space between the price and this trend support is squeezing tight (Compression). This usually tells us one thing: volatility is kicking in and a big move is brewing.
Negative Divergence (RSI): Here’s the warning sign. While the daily chart is trying to make new highs or just hanging on at resistance, the RSI is losing steam and making lower highs. This "Bearish Divergence" is a classic signal that the trend is running on fumes.
Momentum (MACD): The MACD histogram is fading out, which confirms the bulls are getting tired. It hints that profit-taking—and the sellers taking over—is likely just around the corner.
MACROECONOMIC AND FUNDAMENTAL DYNAMICS
Fed Expectations: The market is scrambling to rethink the Fed's rate path for 2025. We are watching the data like hawks right now; even a small sign of cooling in jobs or PMI data could spark a rejection from this resistance and send the DXY correcting downwards.
Bond Yields: Any pullback in the US 10-Year Treasury Yields (US10Y) is going to add fuel to the fire for sellers on the Dollar Index.
Liquidity Hunt: Watch out for the "fakeout." Market makers might try to push the price just above that 100.600 level to grab liquidity and hunt the stops of early shorters before slamming it back down. Keep your eyes peeled on the Price Action here.
STRATEGY AND OUTLOOK
Since we are banging our heads against resistance, opening new long positions here just isn't juicy enough risk-wise.
Bearish Scenario: If we see a hard crash with volume breaking that ascending yellow trendline, that seals the deal for a reversal. If that happens, we’re looking at intermediate supports first, with the main target being that 96.50 level down low.
Bullish Scenario: Unless we get a solid daily candle close above 100.800, any rallies should be looked at as opportunities to sell. If the price stays above that level, then this idea is dead in the water.
Conclusion: It’s a "sit on your hands" moment. Waiting for that trend support to break is the safest confirmation we can get before jumping in.
Disclaimer: Just sharing my personal notes and educational analysis here, not financial advice.
A comprehensive technical look that includes the broader structures and multi-month macroeconomic supply-demand analysis.
TECHNICAL OUTLOOK
Critical Resistance (Purple Zone): We are currently sitting right inside that 100.150 – 100.600 corridor. This is a level we know well—it’s packed with strong selling pressure and smart money order blocks. Think of this zone as a huge mental hurdle for the bulls; trying to go "Long" here without seeing a clean, high-volume breakout is just asking for trouble with a bad risk/reward setup.
Trend Structure: That ascending yellow trendline connecting the lows since September has been holding the price up so far. But look closer—the space between the price and this trend support is squeezing tight (Compression). This usually tells us one thing: volatility is kicking in and a big move is brewing.
Negative Divergence (RSI): Here’s the warning sign. While the daily chart is trying to make new highs or just hanging on at resistance, the RSI is losing steam and making lower highs. This "Bearish Divergence" is a classic signal that the trend is running on fumes.
Momentum (MACD): The MACD histogram is fading out, which confirms the bulls are getting tired. It hints that profit-taking—and the sellers taking over—is likely just around the corner.
MACROECONOMIC AND FUNDAMENTAL DYNAMICS
Fed Expectations: The market is scrambling to rethink the Fed's rate path for 2025. We are watching the data like hawks right now; even a small sign of cooling in jobs or PMI data could spark a rejection from this resistance and send the DXY correcting downwards.
Bond Yields: Any pullback in the US 10-Year Treasury Yields (US10Y) is going to add fuel to the fire for sellers on the Dollar Index.
Liquidity Hunt: Watch out for the "fakeout." Market makers might try to push the price just above that 100.600 level to grab liquidity and hunt the stops of early shorters before slamming it back down. Keep your eyes peeled on the Price Action here.
STRATEGY AND OUTLOOK
Since we are banging our heads against resistance, opening new long positions here just isn't juicy enough risk-wise.
Bearish Scenario: If we see a hard crash with volume breaking that ascending yellow trendline, that seals the deal for a reversal. If that happens, we’re looking at intermediate supports first, with the main target being that 96.50 level down low.
Bullish Scenario: Unless we get a solid daily candle close above 100.800, any rallies should be looked at as opportunities to sell. If the price stays above that level, then this idea is dead in the water.
Conclusion: It’s a "sit on your hands" moment. Waiting for that trend support to break is the safest confirmation we can get before jumping in.
Disclaimer: Just sharing my personal notes and educational analysis here, not financial advice.
Declinazione di responsabilità
Le informazioni e le pubblicazioni non sono intese come, e non costituiscono, consulenza o raccomandazioni finanziarie, di investimento, di trading o di altro tipo fornite o approvate da TradingView. Per ulteriori informazioni, consultare i Termini di utilizzo.
Declinazione di responsabilità
Le informazioni e le pubblicazioni non sono intese come, e non costituiscono, consulenza o raccomandazioni finanziarie, di investimento, di trading o di altro tipo fornite o approvate da TradingView. Per ulteriori informazioni, consultare i Termini di utilizzo.