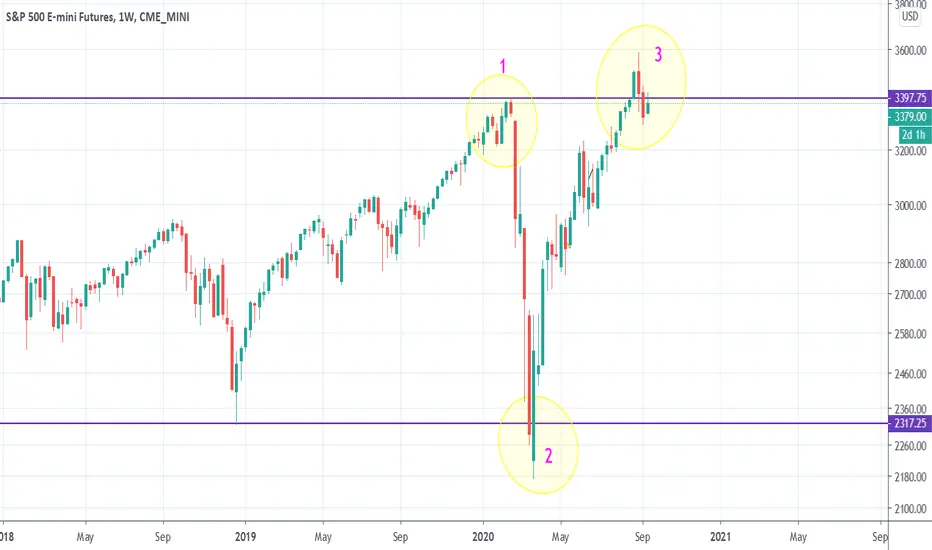
This is not a typical chart I post but something I'll keep an eye on for future development and my own curiosity. The main thing I want to note is the over shoot on figure 2 looks very similar to the overshoot on figure 3. If you noticed both are overshoots of previous lows/highs. The two horizontal blue lines represent the previous low and high.
Nota
Very clear we need above 3400-3425 before I can be full on bull bias. Stimulus needs to be passed.Nota
As long price holds outside the purple range price will gravitate upward.Declinazione di responsabilità
Le informazioni ed i contenuti pubblicati non costituiscono in alcun modo una sollecitazione ad investire o ad operare nei mercati finanziari. Non sono inoltre fornite o supportate da TradingView. Maggiori dettagli nelle Condizioni d'uso.
Declinazione di responsabilità
Le informazioni ed i contenuti pubblicati non costituiscono in alcun modo una sollecitazione ad investire o ad operare nei mercati finanziari. Non sono inoltre fornite o supportate da TradingView. Maggiori dettagli nelle Condizioni d'uso.