Hello traders, stepping into a fresh week with a clear head sets the tone, so here’s a warm dive into what gold is whispering on the weekly chart.
Gold opens the week sitting inside a crucial balance pocket on the W1 map. Momentum is easing, candle bodies are shrinking, and the structure is quietly storing energy for a decisive breakout. This outlook stays loyal to pure Weekly flow — no lower-timeframe noise, just the five-day roadmap drawn by W1 structure itself.
Macro & News Context
The USD steps into a heavy data line-up this week: Retail Sales, GDP, PCE, and Durable Goods.
Any one of these can tilt momentum and sculpt the shape of the weekly candle, so stay alert — the macro winds are active.
WEEKLY — Neutral-Bullish but Losing Momentum
The weekly chart remains bullish in structure but fragile in strength.
Upper wicks = hesitation. Buyers control trend, but conviction is fading.
Key Weekly Zones
🟥 Supply Above
4170–4270 → Rejection shelf. Repeated sell absorption.
4330–4460 → Major distribution ceiling.
4570–4700 → Extreme premium, exhaustion zone.
🟦 Demand Below
3980–3880 → Primary weekly support keeping HLs alive.
3830–3700 → Mid-range accumulation.
3600–3450 → Deep structural foundation.
⚪ Weekly Balance Point: 4040–4140
This is the pivot of the week.
Above → continuation possible.
Below → correction opens.
Weekly Scenarios
Bullish: Hold above 4040–4140 → targets 4170 → 4270 → 4330.
Bearish: Lose 4040 → drop toward 3980 → 3880 → 3830.
Weekly view: A data-driven coin toss — USD strength will decide the winner.
DAILY — Compression Between Supply & Demand
Price is trapped between EMA21 and EMA50, RSI rolling over → indecision.
Daily Supply
4235–4330 → The final battlefield. Every test = heavy rejection.
4140–4210 → Active distribution. Sellers defend aggressively.
Daily Demand
3980–3880 → Key bullish defense.
3720–3580 → Discount base of the October rally.
3450–3300 → Long-term accumulation.
Daily Decision Zone: 4055–4115
Stuck here — no direction until a breakout.
Daily Scenarios
Bullish: D1 close above 4120 → aim for 4210 → 4330.
Bearish: Break & close below 3980 → opens 3880 → 3720.
Daily view: Market is coiling — the next D1 close decides the week.
H4 — Pressure Building Inside a Tight Box
H4 is in a compression pocket 4060–4090.
H4 Supply
4135–4165 → Nearest premium selling.
4210–4240 → Heavy distribution cap.
4320–4350 → Deep premium reversal zone.
H4 Demand
4020–3990 → Nearest support.
3935–3905 → Continuation demand.
3840–3810 → Major accumulation.
H4 Scenarios
Bullish: Reclaim 4090 → 4135–4165 → 4210–4240.
Bearish: Lose 4020 → 3990 → 3935–3905.
H4 view: Expect a violent expansion once it escapes the box.
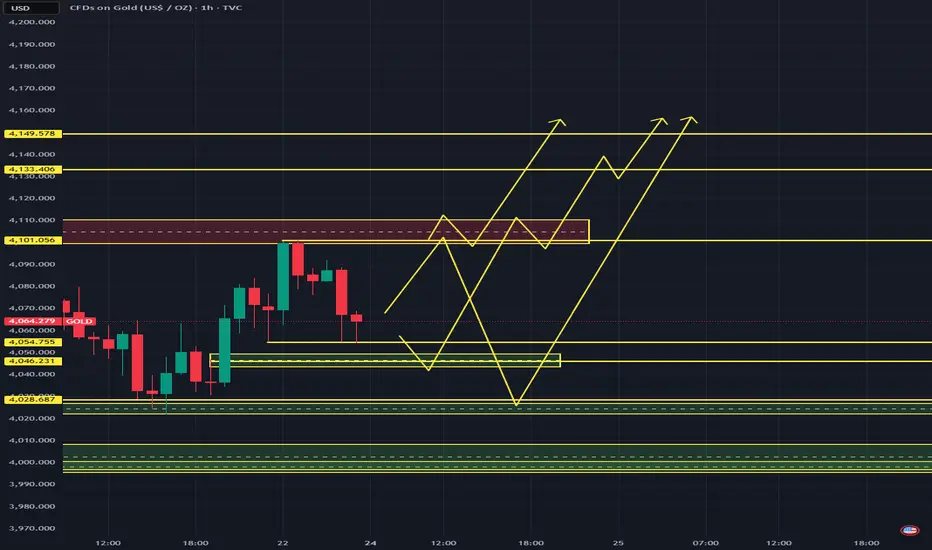
H1 — Liquidity Games Underway
Bias: Neutral–Bullish, liquidity-driven.
4140 = weak high, perfect sweep candidate.
EMAs flat → compression.
RSI mid-50s → room on upside if impulse forms.
H1 Supply
4170–4185 → Extreme premium reversal.
4118–4135 → Weak high liquidity.
4088–4100 → Breaker supply.
H1 Demand
4025–4040 → Key intraday floor.
3988–4005 → Deep H1/H4 confluence.
4055–4065 → Micro accumulation.
H1 Pivot: 4075–4085
Above → bullish continuation.
Below → bearish intraday flow.
Intraday Scenarios
Bullish Liquidity Sweep:
Reclaim 4085 → aim for: 4110 → 4135/40 → 4170/85.
Bearish Retrace:
Reject 4135–4140 → drop toward 4075 → 4053 → 4025–4005.
💡 THE REAL TAKEAWAY — MASTER SUMMARY
📌 Gold is coiled inside multi-timeframe compression.
All major biases depend on a breakout from 4055–4115 (D1) and 4060–4090 (H4).
Upside Bias:
Only valid above 4120 (D1) / 4090 (H4) → targets 4135 → 4170 → 4210+.
Downside Bias:
Confirmed only below 4020 (H4) / 3980 (D1) → targets 3900 → 3830.
Intraday Edge:
Expect a sweep of 4140 before any decisive move.
Most probable play:
↗️ Sweep 4140 → fade
or
↘️ Dip into 4050–4020 → reload upward.
Gold opens the week sitting inside a crucial balance pocket on the W1 map. Momentum is easing, candle bodies are shrinking, and the structure is quietly storing energy for a decisive breakout. This outlook stays loyal to pure Weekly flow — no lower-timeframe noise, just the five-day roadmap drawn by W1 structure itself.
Macro & News Context
The USD steps into a heavy data line-up this week: Retail Sales, GDP, PCE, and Durable Goods.
Any one of these can tilt momentum and sculpt the shape of the weekly candle, so stay alert — the macro winds are active.
WEEKLY — Neutral-Bullish but Losing Momentum
The weekly chart remains bullish in structure but fragile in strength.
Upper wicks = hesitation. Buyers control trend, but conviction is fading.
Key Weekly Zones
🟥 Supply Above
4170–4270 → Rejection shelf. Repeated sell absorption.
4330–4460 → Major distribution ceiling.
4570–4700 → Extreme premium, exhaustion zone.
🟦 Demand Below
3980–3880 → Primary weekly support keeping HLs alive.
3830–3700 → Mid-range accumulation.
3600–3450 → Deep structural foundation.
⚪ Weekly Balance Point: 4040–4140
This is the pivot of the week.
Above → continuation possible.
Below → correction opens.
Weekly Scenarios
Bullish: Hold above 4040–4140 → targets 4170 → 4270 → 4330.
Bearish: Lose 4040 → drop toward 3980 → 3880 → 3830.
Weekly view: A data-driven coin toss — USD strength will decide the winner.
DAILY — Compression Between Supply & Demand
Price is trapped between EMA21 and EMA50, RSI rolling over → indecision.
Daily Supply
4235–4330 → The final battlefield. Every test = heavy rejection.
4140–4210 → Active distribution. Sellers defend aggressively.
Daily Demand
3980–3880 → Key bullish defense.
3720–3580 → Discount base of the October rally.
3450–3300 → Long-term accumulation.
Daily Decision Zone: 4055–4115
Stuck here — no direction until a breakout.
Daily Scenarios
Bullish: D1 close above 4120 → aim for 4210 → 4330.
Bearish: Break & close below 3980 → opens 3880 → 3720.
Daily view: Market is coiling — the next D1 close decides the week.
H4 — Pressure Building Inside a Tight Box
H4 is in a compression pocket 4060–4090.
H4 Supply
4135–4165 → Nearest premium selling.
4210–4240 → Heavy distribution cap.
4320–4350 → Deep premium reversal zone.
H4 Demand
4020–3990 → Nearest support.
3935–3905 → Continuation demand.
3840–3810 → Major accumulation.
H4 Scenarios
Bullish: Reclaim 4090 → 4135–4165 → 4210–4240.
Bearish: Lose 4020 → 3990 → 3935–3905.
H4 view: Expect a violent expansion once it escapes the box.
H1 — Liquidity Games Underway
Bias: Neutral–Bullish, liquidity-driven.
4140 = weak high, perfect sweep candidate.
EMAs flat → compression.
RSI mid-50s → room on upside if impulse forms.
H1 Supply
4170–4185 → Extreme premium reversal.
4118–4135 → Weak high liquidity.
4088–4100 → Breaker supply.
H1 Demand
4025–4040 → Key intraday floor.
3988–4005 → Deep H1/H4 confluence.
4055–4065 → Micro accumulation.
H1 Pivot: 4075–4085
Above → bullish continuation.
Below → bearish intraday flow.
Intraday Scenarios
Bullish Liquidity Sweep:
Reclaim 4085 → aim for: 4110 → 4135/40 → 4170/85.
Bearish Retrace:
Reject 4135–4140 → drop toward 4075 → 4053 → 4025–4005.
💡 THE REAL TAKEAWAY — MASTER SUMMARY
📌 Gold is coiled inside multi-timeframe compression.
All major biases depend on a breakout from 4055–4115 (D1) and 4060–4090 (H4).
Upside Bias:
Only valid above 4120 (D1) / 4090 (H4) → targets 4135 → 4170 → 4210+.
Downside Bias:
Confirmed only below 4020 (H4) / 3980 (D1) → targets 3900 → 3830.
Intraday Edge:
Expect a sweep of 4140 before any decisive move.
Most probable play:
↗️ Sweep 4140 → fade
or
↘️ Dip into 4050–4020 → reload upward.
Declinazione di responsabilità
Le informazioni e le pubblicazioni non sono intese come, e non costituiscono, consulenza o raccomandazioni finanziarie, di investimento, di trading o di altro tipo fornite o approvate da TradingView. Per ulteriori informazioni, consultare i Termini di utilizzo.
Declinazione di responsabilità
Le informazioni e le pubblicazioni non sono intese come, e non costituiscono, consulenza o raccomandazioni finanziarie, di investimento, di trading o di altro tipo fornite o approvate da TradingView. Per ulteriori informazioni, consultare i Termini di utilizzo.