🟡 Gold (XAU/USD) Technical Outlook – Strong Bullish Trend Near All-Time Highs
📊 Market Overview
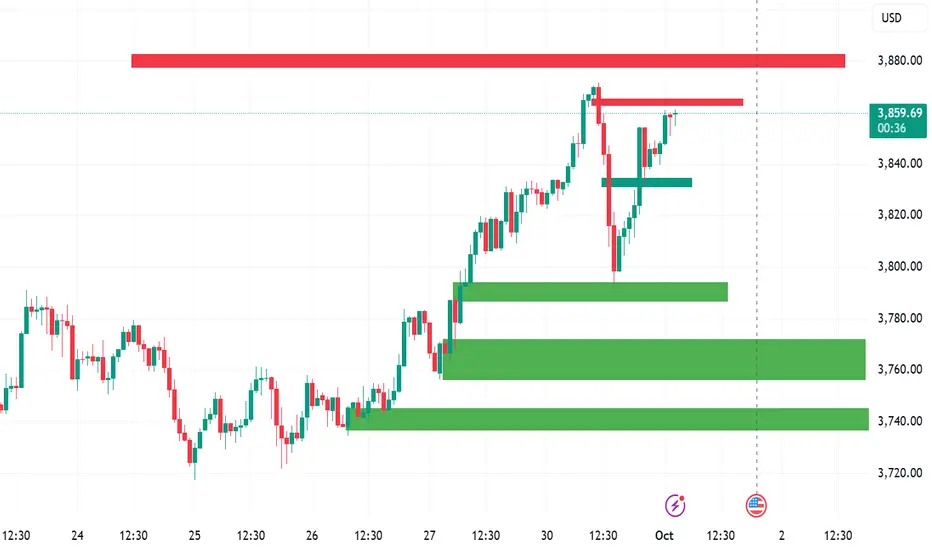
Current Price: ~3,858.55
Trend: Strong Bullish
Technical Summary:
Moving Averages → Strong Buy
Indicators → Strong Buy
Overall Signal → Strong Buy
🔑 Key Levels
Support Zones:
3,854.88 → (Today’s Low)
3,840 – 3,845 → (Previous Support)
3,788 – 3,800 → (Major Zone)
Resistance Levels:
3,861.41 → (Today’s High)
3,871.72 → (52-Week High)
3,934 → (Fibonacci Target)
Pivot Points (Classic):
S1: 3,852.81
Pivot: 3,856.48
R1: 3,862.13
📈 Technical Analysis Deep Dive
Trend Analysis:
Gold is trading well above all major SMAs & EMAs (5–200 days) → confirms strong uptrend.
Price structure shows higher highs & higher lows → bullish momentum intact.
Momentum Indicators:
RSI (14) → 60.49, bullish but not yet overbought.
Stochastic (9,6) → overbought → signals risk of short-term pullback before continuation.
Market Drivers:
Fed’s dovish stance
Weakening U.S. Dollar
Safe-haven demand from geopolitical tensions
💡 Trading Strategy
✅ Breakout Strategy
Watch for a decisive break above 3,861.41 → possible rally towards 3,871.72 (52W high) and 3,934 (Fib projection).
✅ Pullback Strategy
Safer approach → wait for dip towards:
3,840 – 3,845 zone
3,788 – 3,800 zone (major support)
⚠️ Risk Management
Suggested stop-loss → below 3,840 for entries near 3,850.
Bullish outlook invalidated only if price drops below 3,735.
📌 Conclusion
Gold remains in a strong bullish trend supported by both technicals and fundamentals. While a short-term pullback is possible, the broader outlook favors buying on dips or breakouts towards new highs
📊 Market Overview
Current Price: ~3,858.55
Trend: Strong Bullish
Technical Summary:
Moving Averages → Strong Buy
Indicators → Strong Buy
Overall Signal → Strong Buy
🔑 Key Levels
Support Zones:
3,854.88 → (Today’s Low)
3,840 – 3,845 → (Previous Support)
3,788 – 3,800 → (Major Zone)
Resistance Levels:
3,861.41 → (Today’s High)
3,871.72 → (52-Week High)
3,934 → (Fibonacci Target)
Pivot Points (Classic):
S1: 3,852.81
Pivot: 3,856.48
R1: 3,862.13
📈 Technical Analysis Deep Dive
Trend Analysis:
Gold is trading well above all major SMAs & EMAs (5–200 days) → confirms strong uptrend.
Price structure shows higher highs & higher lows → bullish momentum intact.
Momentum Indicators:
RSI (14) → 60.49, bullish but not yet overbought.
Stochastic (9,6) → overbought → signals risk of short-term pullback before continuation.
Market Drivers:
Fed’s dovish stance
Weakening U.S. Dollar
Safe-haven demand from geopolitical tensions
💡 Trading Strategy
✅ Breakout Strategy
Watch for a decisive break above 3,861.41 → possible rally towards 3,871.72 (52W high) and 3,934 (Fib projection).
✅ Pullback Strategy
Safer approach → wait for dip towards:
3,840 – 3,845 zone
3,788 – 3,800 zone (major support)
⚠️ Risk Management
Suggested stop-loss → below 3,840 for entries near 3,850.
Bullish outlook invalidated only if price drops below 3,735.
📌 Conclusion
Gold remains in a strong bullish trend supported by both technicals and fundamentals. While a short-term pullback is possible, the broader outlook favors buying on dips or breakouts towards new highs
Declinazione di responsabilità
Le informazioni ed i contenuti pubblicati non costituiscono in alcun modo una sollecitazione ad investire o ad operare nei mercati finanziari. Non sono inoltre fornite o supportate da TradingView. Maggiori dettagli nelle Condizioni d'uso.
Declinazione di responsabilità
Le informazioni ed i contenuti pubblicati non costituiscono in alcun modo una sollecitazione ad investire o ad operare nei mercati finanziari. Non sono inoltre fornite o supportate da TradingView. Maggiori dettagli nelle Condizioni d'uso.