After being in a multi-year downtrend since its All-Time High (ATH) in August 2018, Graphite India (GRAPHITE) is showing compelling signs of a major trend reversal. Today's powerful price action has broken through two critical resistance levels, suggesting a new uptrend may be underway.
The Long-Term Bottoming Process
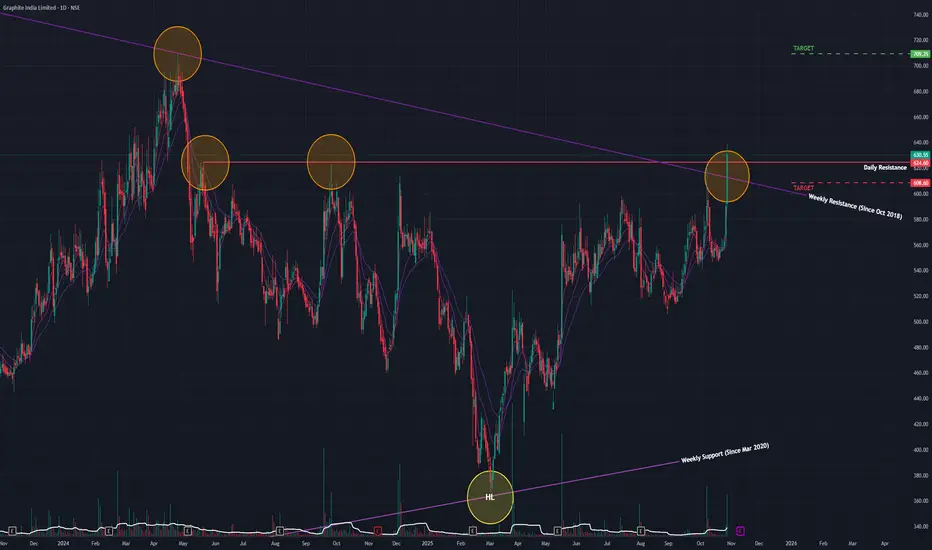
While the stock peaked in 2018, a very long-term bottoming process has been in place. Since April 2020, the stock has been forming a pattern of Higher Lows (clearly visible on the Monthly chart), indicating a gradual shift from supply to demand over the years. Although there was a more recent downtrend from May 2024, that appears to have reversed starting in March 2025.
Today's Decisive Dual Breakout
Today's session (Wednesday, October 29, 2025) was technically very significant:
- Strong Price Surge: The stock rallied by +6.82%.
- Massive Volume: The move was supported by a huge volume of 8.6 million shares, indicating strong buyer conviction.
- Dual Resistance Breach: In a powerful display, the stock broke out and closed above two key resistance levels simultaneously:
1. A long-term angular resistance trendline in place since October 2018.
2. A short-term horizontal resistance trendline formed since May 2024.
Breaking through a confluence of long-term and short-term resistance on high volume is a potent bullish signal.
Broad-Based Technical Strength
This breakout is strongly supported by a clear alignment of momentum indicators across all major timeframes (Monthly, Weekly, and Daily):
- Short-Term EMAs: All three timeframes are in a bullish Positive Crossover (PCO) state.
- RSI (Relative Strength Index): The RSI is also in a rising trend on all three timeframes.
Outlook and Key Levels to Watch
With this dual breakout, the technical landscape has shifted significantly in favor of the bulls.
- Bullish Target: If the stock can sustain this momentum, the next logical area of resistance and potential price target is the ₹709 level. The ideal confirmation, would be a successful re-test of the broken resistance zone followed by a bounce.
- Critical Support: If this breakout proves to be a "fakeout" and the price falls back below the broken resistance, the key support level to watch is ₹608. A close below this would negate the bullish signal.
In conclusion, today's action represents a potentially major turning point for Graphite India. Confirmation via a successful retest would provide the highest confidence that a new long-term uptrend has begun.
The Long-Term Bottoming Process
While the stock peaked in 2018, a very long-term bottoming process has been in place. Since April 2020, the stock has been forming a pattern of Higher Lows (clearly visible on the Monthly chart), indicating a gradual shift from supply to demand over the years. Although there was a more recent downtrend from May 2024, that appears to have reversed starting in March 2025.
Today's Decisive Dual Breakout
Today's session (Wednesday, October 29, 2025) was technically very significant:
- Strong Price Surge: The stock rallied by +6.82%.
- Massive Volume: The move was supported by a huge volume of 8.6 million shares, indicating strong buyer conviction.
- Dual Resistance Breach: In a powerful display, the stock broke out and closed above two key resistance levels simultaneously:
1. A long-term angular resistance trendline in place since October 2018.
2. A short-term horizontal resistance trendline formed since May 2024.
Breaking through a confluence of long-term and short-term resistance on high volume is a potent bullish signal.
Broad-Based Technical Strength
This breakout is strongly supported by a clear alignment of momentum indicators across all major timeframes (Monthly, Weekly, and Daily):
- Short-Term EMAs: All three timeframes are in a bullish Positive Crossover (PCO) state.
- RSI (Relative Strength Index): The RSI is also in a rising trend on all three timeframes.
Outlook and Key Levels to Watch
With this dual breakout, the technical landscape has shifted significantly in favor of the bulls.
- Bullish Target: If the stock can sustain this momentum, the next logical area of resistance and potential price target is the ₹709 level. The ideal confirmation, would be a successful re-test of the broken resistance zone followed by a bounce.
- Critical Support: If this breakout proves to be a "fakeout" and the price falls back below the broken resistance, the key support level to watch is ₹608. A close below this would negate the bullish signal.
In conclusion, today's action represents a potentially major turning point for Graphite India. Confirmation via a successful retest would provide the highest confidence that a new long-term uptrend has begun.
Disclaimer: This analysis is my personal view & for educational purposes only. They shall not be construed as trade or investment advice. Before making any financial decision, it is imperative that you consult with a qualified financial professional.
Declinazione di responsabilità
Le informazioni e le pubblicazioni non sono intese come, e non costituiscono, consulenza o raccomandazioni finanziarie, di investimento, di trading o di altro tipo fornite o approvate da TradingView. Per ulteriori informazioni, consultare i Termini di utilizzo.