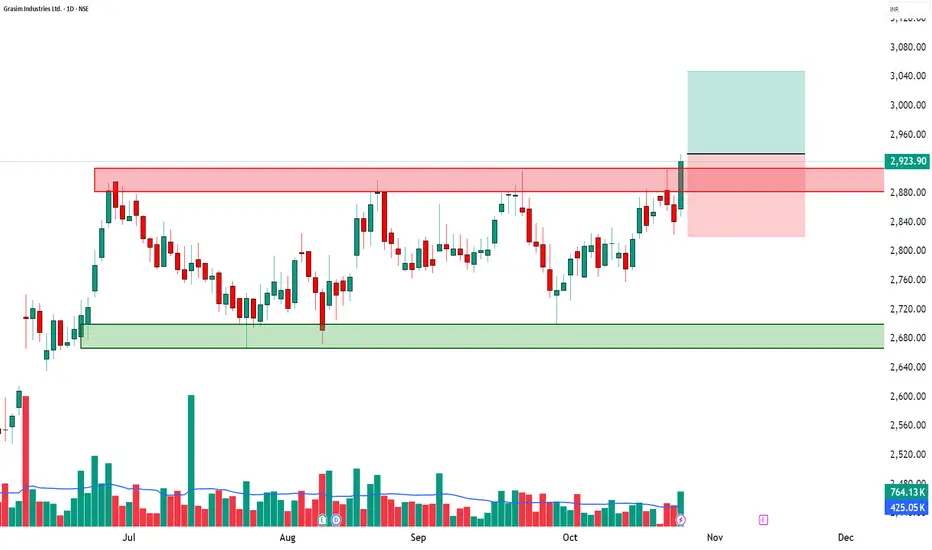
📈 GRASIM | 52-Week Breakout + RSI Surge + High Volume Confirmation 🚀
🔹 Entry Zone: ₹2,923.90 – ₹2,934.00
🔹 Stop Loss: ₹2,820.45 (Risk ~113 pts)
🔹 Supports: 2,869.67 / 2,815.43 / 2,783.27
🔹 Resistances: 2,956.07 / 2,988.23 / 3,042.47
🔹 Swing Demand Zone: ₹2,787 – ₹2,764.50
🔑 Key Highlights
✅ 52-Week Breakout – strong confirmation of bullish momentum continuation
✅ RSI Breakout – trend acceleration backed by strength
✅ Bollinger Band Expansion – volatility breakout indicates fresh momentum
✅ VWAP Alignment – buyers maintaining control across sessions
✅ Volume Spike (1.8x avg) – institutional buying and strong follow-up interest
🎯 STWP Trade View
📊 Momentum favors continued bullish strength. Sustaining above ₹2,956 could extend the move toward ₹2,988–₹3,042 levels.
⚠️ The ₹2,787–₹2,764 zone acts as a key swing base where accumulation is likely to continue if prices retest.
💡 Learning Note
This setup demonstrates how a 52-week breakout with RSI and VWAP confirmation can mark a major trend continuation point. Volume expansion adds conviction, making such setups ideal for momentum-based swing trades.
Final Outlook: Momentum: Strong | Trend: Bullish | Risk: Low | Volume: High
________________________________________
________________________________________
⚠️ Disclosure & Disclaimer – Please Read Carefully
The information shared here is meant purely for learning and awareness. It is not a buy or sell recommendation and should not be taken as investment advice. I am not a SEBI-registered investment adviser, and all views expressed are based on personal study, chart patterns, and publicly available market data.
Trading—whether in stocks or options—carries risk. Markets can move unexpectedly, and losses can sometimes exceed the money you have invested. Past performance or past setups do not guarantee future results.
If you are a beginner, treat this as a guide to understand how the market works and practice on paper trades before risking real money. If you are experienced, always assess your own risk, position sizing, and strategy suitability before entering trades.
Consult a SEBI-registered financial adviser before making any real trading decision. By engaging with this content, you acknowledge full responsibility for your trades and investments.
Position Status: No active position in GRASIM at the time of analysis.
Data Source: TradingView & NSE India (Past Chart Reference) (Historical levels)
💬 Found this useful?
🔼 Give this post a Boost to help more traders discover clean, structured learning.
✍️ Drop your thoughts, questions, or setups in the comments — let’s grow together!
🔁 Share with fellow traders and beginners to spread awareness.
👉 “If you liked this breakdown, follow for more clean, structured setups with discipline at the core.”
🚀 Stay Calm. Stay Clean. Trade With Patience.
Trade Smart | Learn Zones | Be Self-Reliant 📊
📊 STWP | Mentor | Demand & Supply Specialist
🎯 Helping you become a self-reliant & independent trader
🎓 Educational Only: simpletradewithpatience.com
| wa.me/message/6IOPHGOXMGZ4N1
| chat.whatsapp.com/BEYz0tkqP0fJPBCWf59uel
🎯 Helping you become a self-reliant & independent trader
🎓 Educational Only: simpletradewithpatience.com
| wa.me/message/6IOPHGOXMGZ4N1
| chat.whatsapp.com/BEYz0tkqP0fJPBCWf59uel
Declinazione di responsabilità
Le informazioni ed i contenuti pubblicati non costituiscono in alcun modo una sollecitazione ad investire o ad operare nei mercati finanziari. Non sono inoltre fornite o supportate da TradingView. Maggiori dettagli nelle Condizioni d'uso.