This multi-decade chart of HDFC Bank reflects a compelling confluence of Elliott Wave Theory, Smart Money Concepts (SMC), Price Action, and Fibonacci symmetry—all signaling a maturing macro structure as the market approaches a probable Wave-5 terminal zone.
📈 Institutional Market Structure Outlook
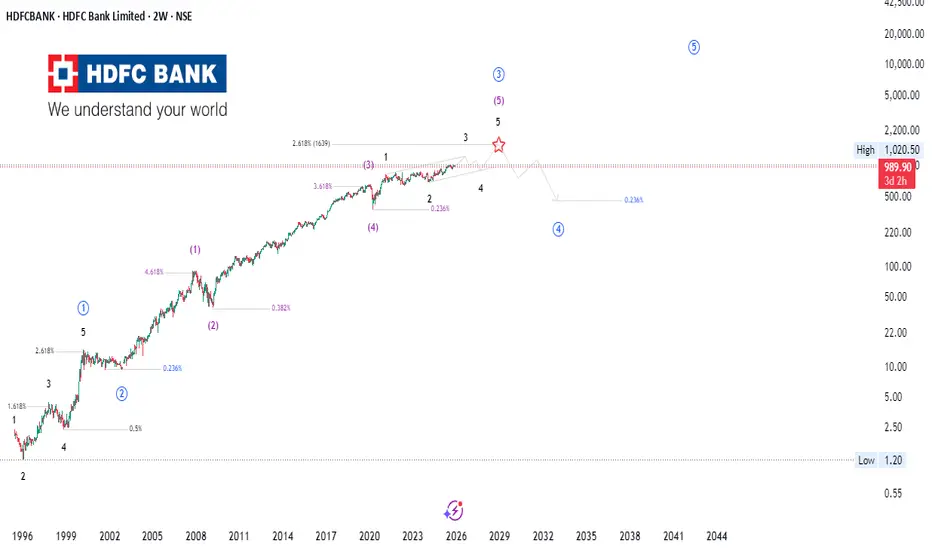
The long-term advance appears to be unfolding within a clean 5-wave impulsive cycle, with the current structure showing:
🧠 Smart Money & Price Action Confluence
🔢 Fibonacci Confluence & Market Cycle Alignment
🔮 What to Monitor Next
🚀 Stay Ahead of the Curve
For more institutional-grade analysis, follow our TradingView profile and turn on alerts 🔔 to never miss actionable insights on market structure, macro waves, and smart-money footprints.
⚠️ Disclaimer
This is not financial advice. The analysis is for educational purposes only. Markets are unpredictable—always conduct your own research before taking positions.
📈 Institutional Market Structure Outlook
The long-term advance appears to be unfolding within a clean 5-wave impulsive cycle, with the current structure showing:
- Wave 3 projecting into the 2.618 extension zone—typical of strong institutional momentum.
- A developing Wave-5 that aligns closely with prior impulse proportions, indicating possible trend exhaustion.
- Clear structural higher highs and higher lows, yet momentum divergence around the projected terminal region (marked with ⭐), hinting at distribution.
🧠 Smart Money & Price Action Confluence
- Price is entering a region historically associated with premium pricing—an area where Smart Money prefers to offload positions.
- Multiple internal liquidity grabs near the highs suggest engineered wicks before a potential macro correction.
- Market behavior resembles a buy-side liquidity sweep, followed by early signs of distribution on lower-timeframe structures.
🔢 Fibonacci Confluence & Market Cycle Alignment
- Long-term impulses consistently respect 1.618 / 2.618 extension geometry.
- The projected corrective leg (Wave 4) aligns with the 0.236–0.382 retracement cluster, forming a probable demand re-accumulation zone.
- Broader cycle rhythm hints at a transition from growth > distribution > mean reversion before Wave-5 completion.
🔮 What to Monitor Next
- Reaction at the terminal Wave-5 zone
- Breakdown of internal structure (SMC CHoCH/ BOS)
- Volume profile shifts indicating institutional distribution
- Retracement into the 0.236–0.382 macro demand zone for long-term opportunities
🚀 Stay Ahead of the Curve
For more institutional-grade analysis, follow our TradingView profile and turn on alerts 🔔 to never miss actionable insights on market structure, macro waves, and smart-money footprints.
⚠️ Disclaimer
This is not financial advice. The analysis is for educational purposes only. Markets are unpredictable—always conduct your own research before taking positions.
Declinazione di responsabilità
Le informazioni e le pubblicazioni non sono intese come, e non costituiscono, consulenza o raccomandazioni finanziarie, di investimento, di trading o di altro tipo fornite o approvate da TradingView. Per ulteriori informazioni, consultare i Termini di utilizzo.
Declinazione di responsabilità
Le informazioni e le pubblicazioni non sono intese come, e non costituiscono, consulenza o raccomandazioni finanziarie, di investimento, di trading o di altro tipo fornite o approvate da TradingView. Per ulteriori informazioni, consultare i Termini di utilizzo.