Current Price (Pre-Opening): ₹1,992.60 (an increase of 4.40, or 0.22%)
Previous Close: ₹1,988.20
Day’s Range: ₹1,983.20 – ₹1,997.50
52-Week Range: ₹1,613.00 – ₹2,037.70
4-Hour Time-Frame Levels (Support & Resistance)
While I couldn’t find a source specifically providing 4-hour timeframe levels for HDFC Bank, here's a useful Elliott Wave–based analysis on the 4-hour chart for guidance:
Support (Invalidation Level): ₹1,590 — if the stock dips below this, the current wave structure may be negated.
Key Pivot Zone: ₹1,710–₹1,720 — around here, bulls might regain control.
Upside Target: Break above ₹1,800 could trigger accelerated upward momentum, with a broader move toward ₹1,970–₹2,000 in progress.
Interpretation & Strategy Implications
Key short-term support lies near ₹1,590. A break below this invalidates the bullish wave setup and warrants caution.
If the stock holds above ₹1,710–₹1,720, buyers could step in, leading to upward momentum toward and beyond ₹1,800.
Daily resistance zones:
Immediate resistance: ₹2,030
Momentum breakout zone: ₹2,050
Major resistance: ₹2,100
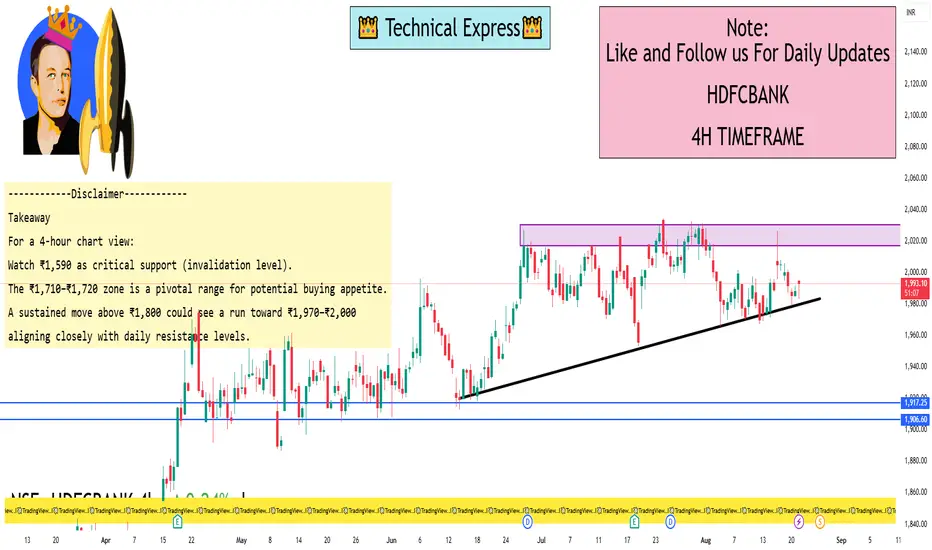
Takeaway
For a 4-hour chart view:
Watch ₹1,590 as critical support (invalidation level).
The ₹1,710–₹1,720 zone is a pivotal range for potential buying appetite.
A sustained move above ₹1,800 could see a run toward ₹1,970–₹2,000, aligning closely with daily resistance levels.
Previous Close: ₹1,988.20
Day’s Range: ₹1,983.20 – ₹1,997.50
52-Week Range: ₹1,613.00 – ₹2,037.70
4-Hour Time-Frame Levels (Support & Resistance)
While I couldn’t find a source specifically providing 4-hour timeframe levels for HDFC Bank, here's a useful Elliott Wave–based analysis on the 4-hour chart for guidance:
Support (Invalidation Level): ₹1,590 — if the stock dips below this, the current wave structure may be negated.
Key Pivot Zone: ₹1,710–₹1,720 — around here, bulls might regain control.
Upside Target: Break above ₹1,800 could trigger accelerated upward momentum, with a broader move toward ₹1,970–₹2,000 in progress.
Interpretation & Strategy Implications
Key short-term support lies near ₹1,590. A break below this invalidates the bullish wave setup and warrants caution.
If the stock holds above ₹1,710–₹1,720, buyers could step in, leading to upward momentum toward and beyond ₹1,800.
Daily resistance zones:
Immediate resistance: ₹2,030
Momentum breakout zone: ₹2,050
Major resistance: ₹2,100
Takeaway
For a 4-hour chart view:
Watch ₹1,590 as critical support (invalidation level).
The ₹1,710–₹1,720 zone is a pivotal range for potential buying appetite.
A sustained move above ₹1,800 could see a run toward ₹1,970–₹2,000, aligning closely with daily resistance levels.
I built a Buy & Sell Signal Indicator with 85% accuracy.
📈 Get access via DM or
WhatsApp: wa.link/d997q0
Contact - +91 76782 40962
| Email: techncialexpress@gmail.com
| Script Coder | Trader | Investor | From India
📈 Get access via DM or
WhatsApp: wa.link/d997q0
Contact - +91 76782 40962
| Email: techncialexpress@gmail.com
| Script Coder | Trader | Investor | From India
Pubblicazioni correlate
Declinazione di responsabilità
Le informazioni e le pubblicazioni non sono intese come, e non costituiscono, consulenza o raccomandazioni finanziarie, di investimento, di trading o di altro tipo fornite o approvate da TradingView. Per ulteriori informazioni, consultare i Termini di utilizzo.