🔍Technical Analysis: Resilience in a Defined Range
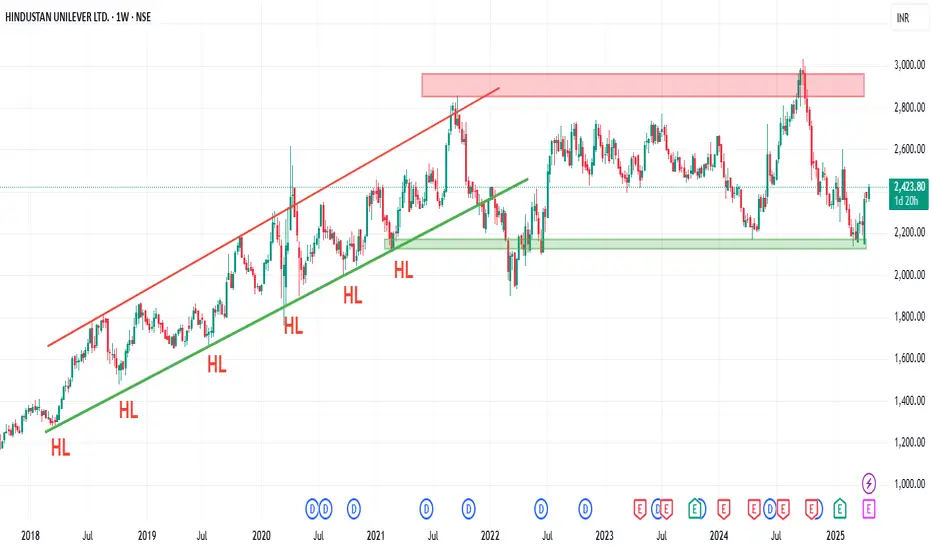
Over the past decade, Hindustan Unilever Ltd (HUL) has exhibited a commendable upward trajectory, characterized by a consistent pattern of higher highs and higher lows from 2018 to 2021. Since 2021, the stock has been oscillating within a well-defined range of ₹2,000 to ₹3,000. Notably, the ₹3,000 mark has acted as a significant resistance level, while the ₹2,100–₹2,200 zone has provided robust support.
In recent weeks, HUL has demonstrated resilience by rebounding from the ₹2,100–₹2,200 support zone, indicating renewed buying interest. This movement suggests a potential bullish momentum, especially if the stock sustains above this support.
Key Technical Levels:
Support Zones: ₹2,100–₹2,200 (Primary), ₹1,900 (Secondary)
Resistance Levels: ₹2,800 (Initial Target), ₹2,900 (Secondary Target), ₹3,000 (Tertiary Target)
Investors should monitor these levels closely, especially with the upcoming Q4 FY25 results scheduled for April 24, 2025. A positive earnings report could propel the stock towards its all-time high, while any negative surprises might test the established support zones.
📊Fundamental Analysis:
Over the past two months, HUL's stock has witnessed an upward movement. Several factors contribute to this trend:
Positive Q3 FY24 Earnings: The company's ability to maintain profitability despite market headwinds has instilled confidence among investors.
Anticipation of Q4 Results: With the Q4 FY25 results scheduled for April 24, 2025, market participants are optimistic about continued positive performance, potentially driving the stock higher.
Defensive Sector Appeal: As a leading player in the FMCG sector, HUL is considered a defensive stock, attracting investors seeking stability amidst market volatility.
📌Q3 FY24 Key Financial Highlights:
🔹 Growth in the Home Care and Beauty & Wellbeing segments contributed to the rise.
🔹 Operating margins improved due to better cost controls and volume-led growth.
🔹 Investor sentiment has been optimistic ahead of Q4 results, helping the stock gain in the past 2 months.
✅Conclusion :
HUL is showing signs of bullish continuation if Q4 results support it. Key levels are clear — ₹2,100 is your safety net, and ₹3,000 your breakout goal. Watch results on April 24, and plan accordingly.
⚠️Disclaimer :
This report is for educational and informational purposes only and does not constitute investment advice. Please consult your financial advisor before investing.
Over the past decade, Hindustan Unilever Ltd (HUL) has exhibited a commendable upward trajectory, characterized by a consistent pattern of higher highs and higher lows from 2018 to 2021. Since 2021, the stock has been oscillating within a well-defined range of ₹2,000 to ₹3,000. Notably, the ₹3,000 mark has acted as a significant resistance level, while the ₹2,100–₹2,200 zone has provided robust support.
In recent weeks, HUL has demonstrated resilience by rebounding from the ₹2,100–₹2,200 support zone, indicating renewed buying interest. This movement suggests a potential bullish momentum, especially if the stock sustains above this support.
Key Technical Levels:
Support Zones: ₹2,100–₹2,200 (Primary), ₹1,900 (Secondary)
Resistance Levels: ₹2,800 (Initial Target), ₹2,900 (Secondary Target), ₹3,000 (Tertiary Target)
Investors should monitor these levels closely, especially with the upcoming Q4 FY25 results scheduled for April 24, 2025. A positive earnings report could propel the stock towards its all-time high, while any negative surprises might test the established support zones.
📊Fundamental Analysis:
Over the past two months, HUL's stock has witnessed an upward movement. Several factors contribute to this trend:
Positive Q3 FY24 Earnings: The company's ability to maintain profitability despite market headwinds has instilled confidence among investors.
Anticipation of Q4 Results: With the Q4 FY25 results scheduled for April 24, 2025, market participants are optimistic about continued positive performance, potentially driving the stock higher.
Defensive Sector Appeal: As a leading player in the FMCG sector, HUL is considered a defensive stock, attracting investors seeking stability amidst market volatility.
📌Q3 FY24 Key Financial Highlights:
- Total Income: ₹15,818 Cr (vs ₹15,926 Cr in Q2 FY24 and ₹15,567 Cr in Q3 FY23)
- Total Expenses: ₹12,123 Cr (vs ₹12,139 Cr in Q2 FY24 and ₹11,902 Cr in Q3 FY23)
- Total Operating Profits: ₹3,695 Cr (vs ₹3,787 Cr in Q2 FY24 and ₹3,665 Cr in Q3 FY23)
- Profit Before Tax: ₹3,982 Cr (vs ₹3,542 Cr in Q2 FY24 and ₹3,445 Cr in Q3 FY23)
- Profit After Tax: ₹2,989 Cr (vs ₹2,595 Cr in Q2 FY24 and ₹2,508 Cr in Q3 FY23)
- Diluted Normalized EPS: ₹12.70 (vs ₹11.03 in Q2 FY24 and ₹10.68 in Q3 FY23)
🔹 Growth in the Home Care and Beauty & Wellbeing segments contributed to the rise.
🔹 Operating margins improved due to better cost controls and volume-led growth.
🔹 Investor sentiment has been optimistic ahead of Q4 results, helping the stock gain in the past 2 months.
✅Conclusion :
HUL is showing signs of bullish continuation if Q4 results support it. Key levels are clear — ₹2,100 is your safety net, and ₹3,000 your breakout goal. Watch results on April 24, and plan accordingly.
⚠️Disclaimer :
This report is for educational and informational purposes only and does not constitute investment advice. Please consult your financial advisor before investing.
Declinazione di responsabilità
Le informazioni ed i contenuti pubblicati non costituiscono in alcun modo una sollecitazione ad investire o ad operare nei mercati finanziari. Non sono inoltre fornite o supportate da TradingView. Maggiori dettagli nelle Condizioni d'uso.
Declinazione di responsabilità
Le informazioni ed i contenuti pubblicati non costituiscono in alcun modo una sollecitazione ad investire o ad operare nei mercati finanziari. Non sono inoltre fornite o supportate da TradingView. Maggiori dettagli nelle Condizioni d'uso.
