📊 Trade Context
Symbol: IWM (Russell 2000 ETF)
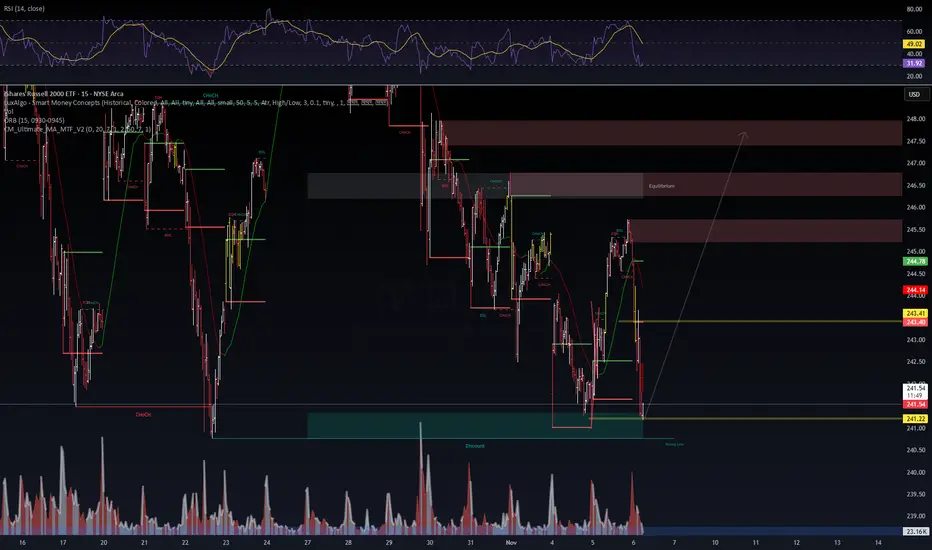
Timeframe: 15-minute
Current Price Zone: $241.20–$241.40
Structure: Clear BOS (Break of Structure) → CHoCH (Change of Character) → Discount zone retest.
RSI: ~29 (oversold), showing early divergence potential.
⚙️ Setup Breakdown
Discount Zone: The green zone marks a liquidity sweep and potential “strong low.”
Confluence:
Volume spike at discount (buyer absorption).
RSI divergence (momentum exhaustion on the downside).
Structural sweep of previous equal lows.
Immediate Resistance: $243.40 → minor supply zone.
Main Target Zone: $246.00–$247.50 (equilibrium and prior inefficiency zone).
🧠 Trade Thesis
Buyers are defending the discount region around $241.00.
Expectation: Liquidity grab → reaccumulation → move toward equilibrium.
Entry: Around $241.20 (discount reaction confirmed with bullish candle).
Stop-loss: Below $240.70 (invalidate if lower low forms).
Take-profit:
TP1: $243.40 (intraframe supply)
TP2: $246.40 (equilibrium)
TP3: $247.50 (full mitigation zone)
🕹️ Execution Plan
Wait for bullish confirmation on smaller timeframes (M5–M1 BOS/CHoCH).
Use reduced size at entry; scale as momentum confirms.
Watch RSI reclaim above 40 — it usually aligns with structural reversal.
⚠️ Risk and Management
Risk/Reward ~1:3.5 (optimal under current volatility).
Avoid adding below $241.00 — zone invalidates below $240.70.
Volume must increase on breakout above $243.40; otherwise, partial exit recommended.
Symbol:
Timeframe: 15-minute
Current Price Zone: $241.20–$241.40
Structure: Clear BOS (Break of Structure) → CHoCH (Change of Character) → Discount zone retest.
RSI: ~29 (oversold), showing early divergence potential.
⚙️ Setup Breakdown
Discount Zone: The green zone marks a liquidity sweep and potential “strong low.”
Confluence:
Volume spike at discount (buyer absorption).
RSI divergence (momentum exhaustion on the downside).
Structural sweep of previous equal lows.
Immediate Resistance: $243.40 → minor supply zone.
Main Target Zone: $246.00–$247.50 (equilibrium and prior inefficiency zone).
🧠 Trade Thesis
Buyers are defending the discount region around $241.00.
Expectation: Liquidity grab → reaccumulation → move toward equilibrium.
Entry: Around $241.20 (discount reaction confirmed with bullish candle).
Stop-loss: Below $240.70 (invalidate if lower low forms).
Take-profit:
TP1: $243.40 (intraframe supply)
TP2: $246.40 (equilibrium)
TP3: $247.50 (full mitigation zone)
🕹️ Execution Plan
Wait for bullish confirmation on smaller timeframes (M5–M1 BOS/CHoCH).
Use reduced size at entry; scale as momentum confirms.
Watch RSI reclaim above 40 — it usually aligns with structural reversal.
⚠️ Risk and Management
Risk/Reward ~1:3.5 (optimal under current volatility).
Avoid adding below $241.00 — zone invalidates below $240.70.
Volume must increase on breakout above $243.40; otherwise, partial exit recommended.
WaverVanir ⚡ To grow and conquer
stocktwits.com/WaverVanir | wavervanir.com | buymeacoffee.com/wavervanir
Not Investment Advice
stocktwits.com/WaverVanir | wavervanir.com | buymeacoffee.com/wavervanir
Not Investment Advice
Declinazione di responsabilità
Le informazioni e le pubblicazioni non sono intese come, e non costituiscono, consulenza o raccomandazioni finanziarie, di investimento, di trading o di altro tipo fornite o approvate da TradingView. Per ulteriori informazioni, consultare i Termini di utilizzo.