📊 Weekly Support and Resistance Levels
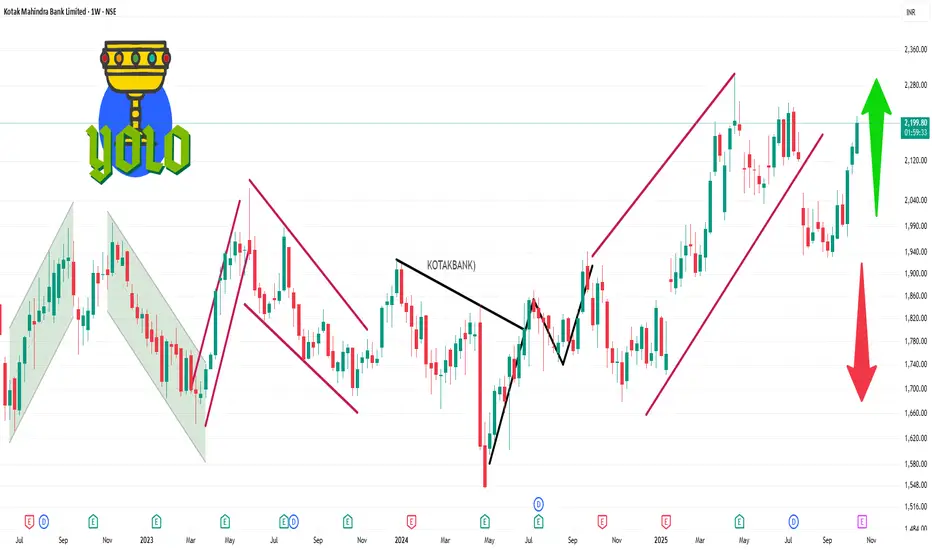
Immediate Support Levels: ₹2,109.47, ₹2,068.83, ₹2,044.67
Immediate Resistance Levels: ₹2,174.27, ₹2,198.43, ₹2,239.07
A decisive move above ₹2,174.27 could signal a bullish breakout, while a drop below ₹2,109.47 may indicate a bearish trend.
📈 Technical Indicators Summary
RSI (14): 73.44 — Indicates potential overbought conditions.
MACD: 46.92 — Suggests bullish momentum.
ADX (14): 32.50 — Reflects a strong trend.
EMA (5): ₹2,176.59 — Indicates short-term bullishness.
EMA (50): ₹2,067.60 — Supports medium-term bullish outlook.
EMA (200): ₹2,057.89 — Confirms long-term bullish trend.
Pubblicazioni correlate
Declinazione di responsabilità
Le informazioni e le pubblicazioni non sono intese come, e non costituiscono, consulenza o raccomandazioni finanziarie, di investimento, di trading o di altro tipo fornite o approvate da TradingView. Per ulteriori informazioni, consultare i Termini di utilizzo.