MATIC / USDT 1D chart
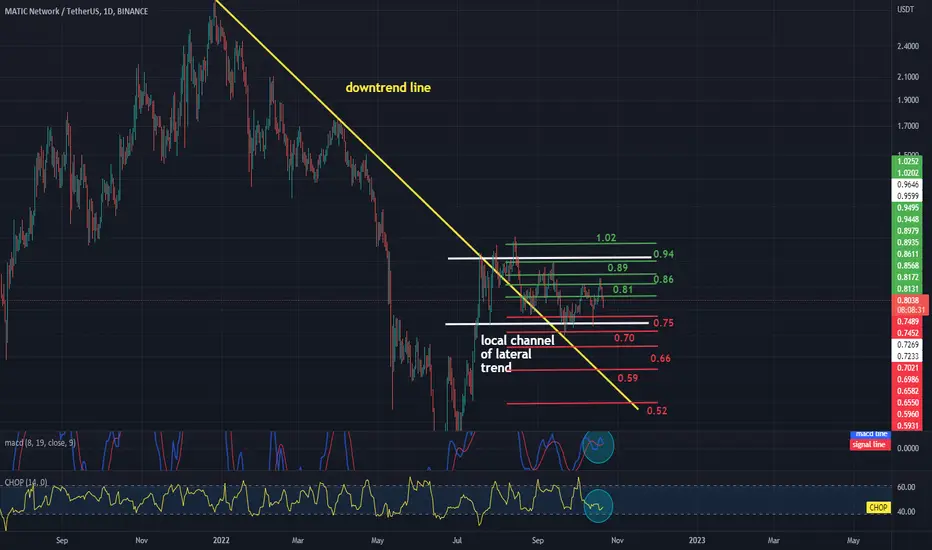
Please take a look at the MATICUSDT 1 day chart, as you can see the trend line has broken out and we are currently in the local sideways trend channel.
Now let's move on to the price support line, and as you can see, we have the first support at seventy-five cents, the next support at seventy cents, sixty-six cents, fifty-nine cents, and fifty-two cents.
Now let's see what resistance price has to face, and the first resistance is eighty-one cents, the next one at eighty-six cents, eighty-nine cents, ninety-four cents, and one dollar two cents.
Now please note the CHOP index which indicates that energy has been used up and the MACD indicator shows that we are close to entering a downtrend.
Declinazione di responsabilità
Le informazioni ed i contenuti pubblicati non costituiscono in alcun modo una sollecitazione ad investire o ad operare nei mercati finanziari. Non sono inoltre fornite o supportate da TradingView. Maggiori dettagli nelle Condizioni d'uso.
Declinazione di responsabilità
Le informazioni ed i contenuti pubblicati non costituiscono in alcun modo una sollecitazione ad investire o ad operare nei mercati finanziari. Non sono inoltre fornite o supportate da TradingView. Maggiori dettagli nelle Condizioni d'uso.