📈 1-Hour Timeframe Technical Overview
Trend: The stock is exhibiting a bullish trend on the 1-hour chart, characterized by higher highs and higher lows.
Resistance Levels:
Immediate Resistance: ₹70.
Key Resistance: ₹75.
Support Levels:
Immediate Support: ₹65.
Key Support: ₹62.
Pivot Points:
Central Pivot: ₹64.84
Resistance (R1): ₹66.13
Support (S1): ₹63.55
🔧 Technical Indicators
RSI (Relative Strength Index): Currently neutral, indicating no overbought or oversold conditions.
Moving Averages:
50-period EMA: Trending upwards, supporting the bullish momentum.
200-period EMA: Also trending upwards, confirming the long-term bullish trend.
MACD (Moving Average Convergence Divergence): The MACD line is above the signal line, suggesting bullish momentum.
Volume: Increasing volume on upward movements indicates strong buying interest.
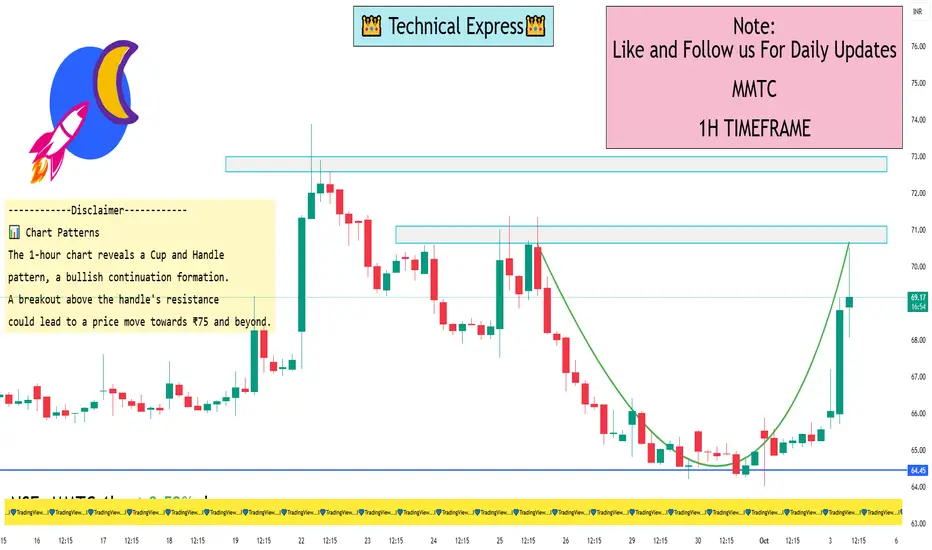
📊 Chart Patterns
The 1-hour chart reveals a Cup and Handle pattern, a bullish continuation formation. A breakout above the handle's resistance could lead to a price move towards ₹75 and beyond.
✅ Summary
MMTC Ltd is showing bullish signals on the 1-hour chart, with key resistance at ₹70 and ₹75, and support at ₹65 and ₹62. Technical indicators confirm the upward momentum. A breakout above ₹70 could signal further bullish movement.
Trend: The stock is exhibiting a bullish trend on the 1-hour chart, characterized by higher highs and higher lows.
Resistance Levels:
Immediate Resistance: ₹70.
Key Resistance: ₹75.
Support Levels:
Immediate Support: ₹65.
Key Support: ₹62.
Pivot Points:
Central Pivot: ₹64.84
Resistance (R1): ₹66.13
Support (S1): ₹63.55
🔧 Technical Indicators
RSI (Relative Strength Index): Currently neutral, indicating no overbought or oversold conditions.
Moving Averages:
50-period EMA: Trending upwards, supporting the bullish momentum.
200-period EMA: Also trending upwards, confirming the long-term bullish trend.
MACD (Moving Average Convergence Divergence): The MACD line is above the signal line, suggesting bullish momentum.
Volume: Increasing volume on upward movements indicates strong buying interest.
📊 Chart Patterns
The 1-hour chart reveals a Cup and Handle pattern, a bullish continuation formation. A breakout above the handle's resistance could lead to a price move towards ₹75 and beyond.
✅ Summary
MMTC Ltd is showing bullish signals on the 1-hour chart, with key resistance at ₹70 and ₹75, and support at ₹65 and ₹62. Technical indicators confirm the upward momentum. A breakout above ₹70 could signal further bullish movement.
I built a Buy & Sell Signal Indicator with 85% accuracy.
📈 Get access via DM or
WhatsApp: wa.link/d997q0
Contact - +91 76782 40962
| Email: techncialexpress@gmail.com
| Script Coder | Trader | Investor | From India
📈 Get access via DM or
WhatsApp: wa.link/d997q0
Contact - +91 76782 40962
| Email: techncialexpress@gmail.com
| Script Coder | Trader | Investor | From India
Pubblicazioni correlate
Declinazione di responsabilità
Le informazioni e le pubblicazioni non sono intese come, e non costituiscono, consulenza o raccomandazioni finanziarie, di investimento, di trading o di altro tipo fornite o approvate da TradingView. Per ulteriori informazioni, consultare i Termini di utilizzo.