This analysis is based on the Initiative Analysis (IA) method.
Hello traders and investors!
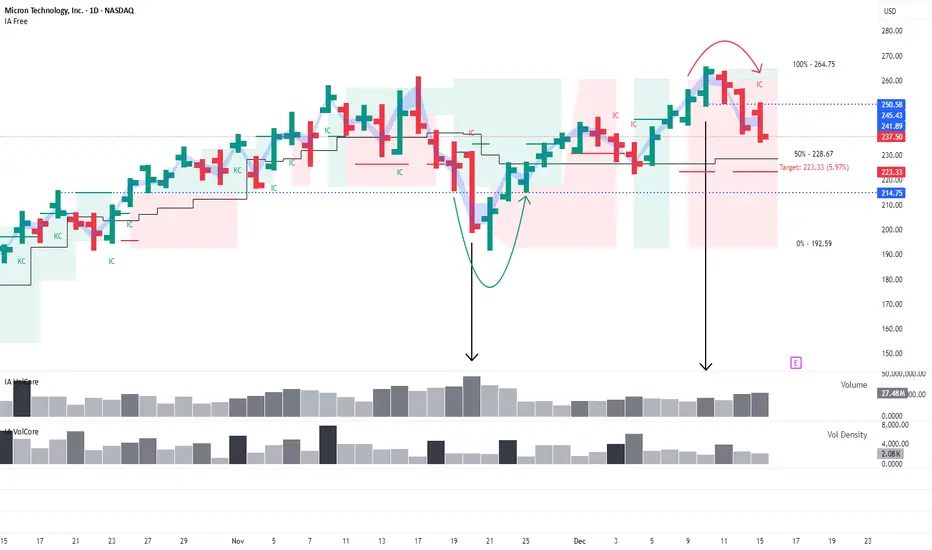
Micron Technology (MU) shares are currently trading in a sideways range. At this stage, the active initiative belongs to the seller.
At the upper boundary of the range, a false breakout was formed — a breakout above the range high on increased volume.
After that, the seller engulfed the buyer’s candle, which strengthens the seller’s position within the range.
It is also worth noting that the key candle of the seller’s initiative — the candle with the highest volume (marked as IC on the chart) — also belongs to the seller, confirming supply-side control.
Potential seller targets:
The blue band on the chart represents the minimum price range of the candle in which at least 50% of the volume was traded, helping to more accurately identify the zone of market participant activity.
Wishing you profitable trades!
Hello traders and investors!
Micron Technology (MU) shares are currently trading in a sideways range. At this stage, the active initiative belongs to the seller.
At the upper boundary of the range, a false breakout was formed — a breakout above the range high on increased volume.
After that, the seller engulfed the buyer’s candle, which strengthens the seller’s position within the range.
It is also worth noting that the key candle of the seller’s initiative — the candle with the highest volume (marked as IC on the chart) — also belongs to the seller, confirming supply-side control.
Potential seller targets:
- first target — 223.33
- second target — 214.75
The blue band on the chart represents the minimum price range of the candle in which at least 50% of the volume was traded, helping to more accurately identify the zone of market participant activity.
Wishing you profitable trades!
Рыночные сценарии, инструкция к индикатору, практические примеры — t.me/ialogic
Market scenarios, indicator guide, practical examples — t.me/initiativeanalysis
Clarity on the Chart. Smart Trading Decisions
Market scenarios, indicator guide, practical examples — t.me/initiativeanalysis
Clarity on the Chart. Smart Trading Decisions
Declinazione di responsabilità
Le informazioni e le pubblicazioni non sono intese come, e non costituiscono, consulenza o raccomandazioni finanziarie, di investimento, di trading o di altro tipo fornite o approvate da TradingView. Per ulteriori informazioni, consultare i Termini di utilizzo.