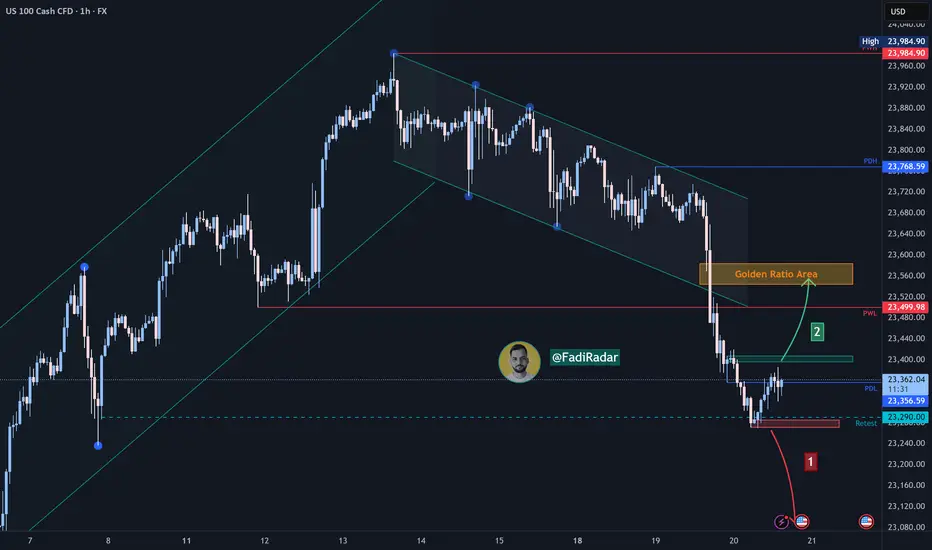
The index is moving in a bullish trend on the higher timeframes (Daily – H4), while showing a bearish move on the 1H timeframe. Currently, it is trading near the 23,340 area.
🔻 Bearish Scenario:
If the price breaks below 23,270 and holds, it may head to retest 23,080.
🔺 Bullish Scenario:
If the price manages to break and hold above 23,400, this could support a continuation towards 23,560 (a potential reversal zone – Fibonacci golden area). However, if buying momentum continues, the path could extend towards 23,680.
Declinazione di responsabilità
Le informazioni ed i contenuti pubblicati non costituiscono in alcun modo una sollecitazione ad investire o ad operare nei mercati finanziari. Non sono inoltre fornite o supportate da TradingView. Maggiori dettagli nelle Condizioni d'uso.
Declinazione di responsabilità
Le informazioni ed i contenuti pubblicati non costituiscono in alcun modo una sollecitazione ad investire o ad operare nei mercati finanziari. Non sono inoltre fornite o supportate da TradingView. Maggiori dettagli nelle Condizioni d'uso.