📊 Nasdaq – Technical Setup & Market Catalysts
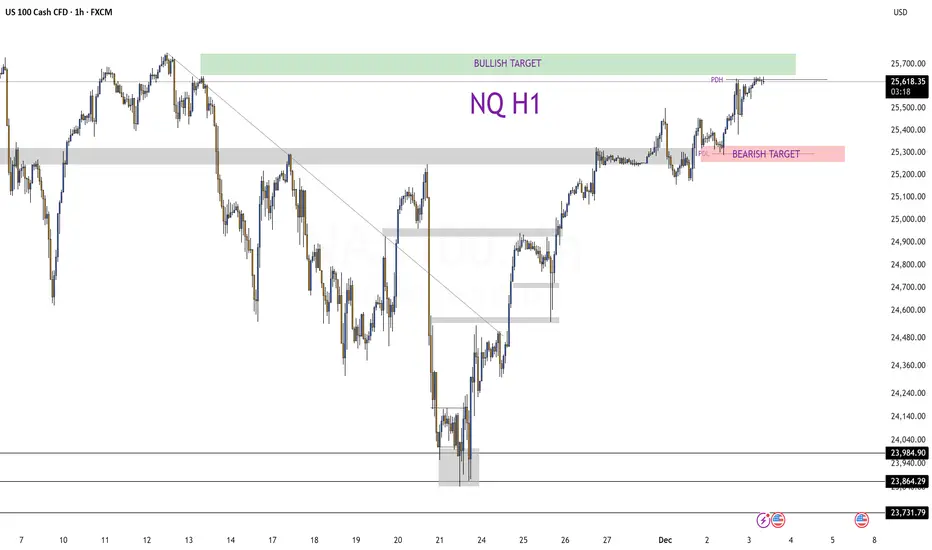
The index recently tested a previously unfilled Fair Value Gap (H1 timeframe) and swept liquidity from last week’s accumulation — a process that often precedes new directional moves. The move cleared many trapped positions and reset the orderbook.
Currently, Nasdaq is sitting below a strong resistance zone; price appears to be weakening, which increases the probability of a short-term pullback toward the Previous Day Low (PDL) to collect more liquidity before any further upside attempt.
Momentum indicators and price structure suggest caution: while the general uptrend remains, a lack of upward acceleration and signs of hesitation point toward a possible consolidation or retracement.
🌍 Fundamental & Macro Context
Optimism remains in markets thanks to rising investor expectations of a rate cut by the Federal Reserve (Fed) this December. This sentiment supports risk assets, and tech stocks in particular — historically sensitive to interest rates and discounting future earnings.
However, some analysts warn that valuations in the tech sector — which heavily influence Nasdaq — are rich relative to earnings. The forward P/E ratio sits well above long-term averages, increasing vulnerability if economic data disappoints or if rate cuts are delayed.
Broader macro conditions remain fragile: global yield curves and bond markets show signs of stress, which could add volatility. Also, inflation trends and upcoming U.S. data releases could shift sentiment quickly.
🎯 What to Watch Next
Pullback zone: Look for support near the PDL or recent liquidity area — potential buying zone if price stabilizes.
Breakout zone: If Nasdaq breaks above resistance with strength and volume, upside is open toward higher targets set pre-rally.
Catalysts: Fed rate-cut expectations, upcoming economic data (inflation, employment, PMI), and tech sector earnings will influence direction strongly.
Declinazione di responsabilità
Le informazioni e le pubblicazioni non sono intese come, e non costituiscono, consulenza o raccomandazioni finanziarie, di investimento, di trading o di altro tipo fornite o approvate da TradingView. Per ulteriori informazioni, consultare i Termini di utilizzo.
Declinazione di responsabilità
Le informazioni e le pubblicazioni non sono intese come, e non costituiscono, consulenza o raccomandazioni finanziarie, di investimento, di trading o di altro tipo fornite o approvate da TradingView. Per ulteriori informazioni, consultare i Termini di utilizzo.