NAS100 Technical Analysis (Daily Chart)
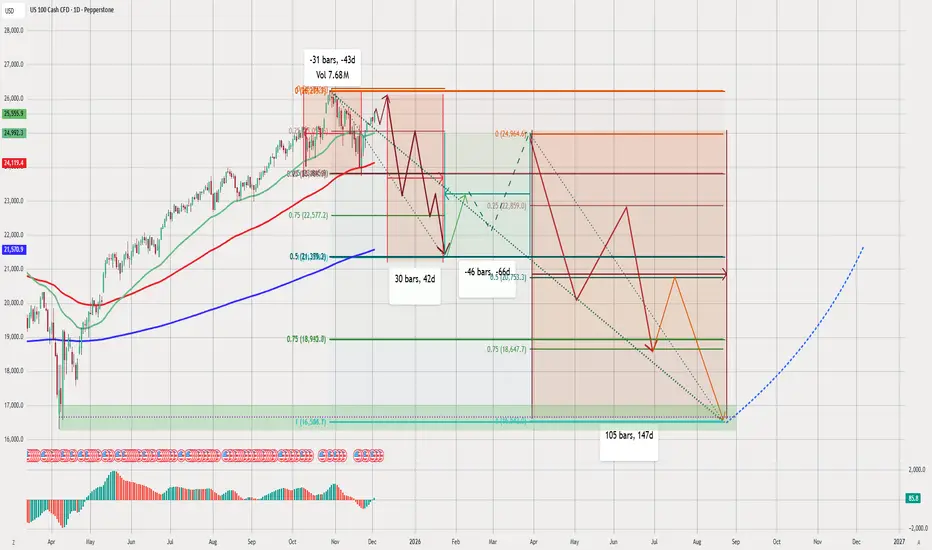
chart presents a medium-term bearish outlook, followed by a long-term bullish reversal. combining Fibonacci retracements, cycle timing (bars/days), moving averages, and wave projections to create a full market roadmap.
Below is a structured analysis:
1️⃣ Current Market Structure
NAS100 reached a major top near 26,000 before reversing.
Price broke below the short-term trendline and is dropping toward deeper support.
The red zig-zag pattern reflects expectation of continued selling pressure.
This suggests the index is entering a medium-term correction.
2️⃣ Fibonacci Levels (Key Zones Identified)
chart uses multiple retracements:
Current swing retracement levels
0.25 – 23,869
0.5 – 21,383
0.75 – 18,993
These levels match the projected downward path.
Major support zone
Large green rectangular zone near 16,300 – 17,000
This is aligned with:
Long-term Fibonacci support
Previous accumulation zone
Blue dotted long-term rising trendline
This zone is likely the macro bottom of the cycle.
3️⃣ Moving Averages (Trend Signals)
using:
Green MA (short-term)
Red MA (medium-term)
Blue MA (200-day long-term)
Current price is:
Breaking below the green and red MAs
Approaching the 200-day MA around 21,000
A break under the 200-day MA confirms a total trend shift to bearish.
4️⃣ Cycle Timing (Bars/Days)
chart marks three key cycles:
🔹 From the top to first support:
31 bars, 43 days
🔹 Next consolidation period:
30 bars, 42 days
🔹 Full correction phase to the bottom:
105 bars, 147 days
This indicates a highly structured time cycle, showing the correction may last until August–September 2026.
5️⃣ Expected Bearish Phase (Primary Scenario)
red path suggests:
Continued decline from current levels
Multiple lower highs and lower lows
A temporary bounce around 21,800
Then deeper drops toward 18,600 – 19,000
Extended capitulation down to the 16,300 zone (major support)
This zone is highlighted heavily, suggesting it is final bearish target.
6️⃣ Recovery Phase (Bullish Scenario)
After the bottom:
🟦 Bullish reversal zone: 16,300
The blue dotted line indicates:
A multi-month recovery
Strong upside momentum
Reestablishment of a long-term bullish trend
Possible return to previous highs later
This forms a textbook "macro correction → macro rally" cycle.
7️⃣ Summary of Your Market View
📉 Short-Term Bias: Strongly Bearish
Market breaking structure
Cycle timing supports continued decline
Price heading for deeper Fibonacci levels
📉 Medium-Term Bias: Bearish
Expecting multiple waves of selling
Target zone: 18,600 then 16,300
📈 Long-Term Bias: Bullish
After the cycle completes, NAS100 should resume its uptrend
Blue dotted projection shows a long rally into late 2026 and 2027
✔️ Final Outlook
chart shows a well-planned, detailed scenario:
A multi-leg correction
Followed by a strong, long-term bullish cycle
The 16,300 zone is the “macro bottom”
Timing suggests bottoming around August–September 2026
analysis is consistent, logical, and follows smart technical principles.
Declinazione di responsabilità
Le informazioni e le pubblicazioni non sono intese come, e non costituiscono, consulenza o raccomandazioni finanziarie, di investimento, di trading o di altro tipo fornite o approvate da TradingView. Per ulteriori informazioni, consultare i Termini di utilizzo.
Declinazione di responsabilità
Le informazioni e le pubblicazioni non sono intese come, e non costituiscono, consulenza o raccomandazioni finanziarie, di investimento, di trading o di altro tipo fornite o approvate da TradingView. Per ulteriori informazioni, consultare i Termini di utilizzo.