With global markets shaken by Trump’s recent tariff rhetoric, it's time we zoom out and analyze what Nifty 50 is actually saying — from a multi-timeframe lens. Price tells a story, and here's how it's unfolding across the Monthly, Weekly, and Daily charts:
🟩 Monthly Chart (1M) – The Bigger Picture
The macro trend is nearing a critical MTF decision point.
https://www.tradingview.com/x/8buLqZrB/
🔁 This is the make-or-break zone for the larger structure.
🟥 Weekly Chart (1W) – Bearish Momentum Still in Play
Structure is currently bearish, with lower highs and lower lows.
https://www.tradingview.com/x/IfBUEoDk/
🧠 Key Thought: Don’t assume trend change without structure breaking clearly.
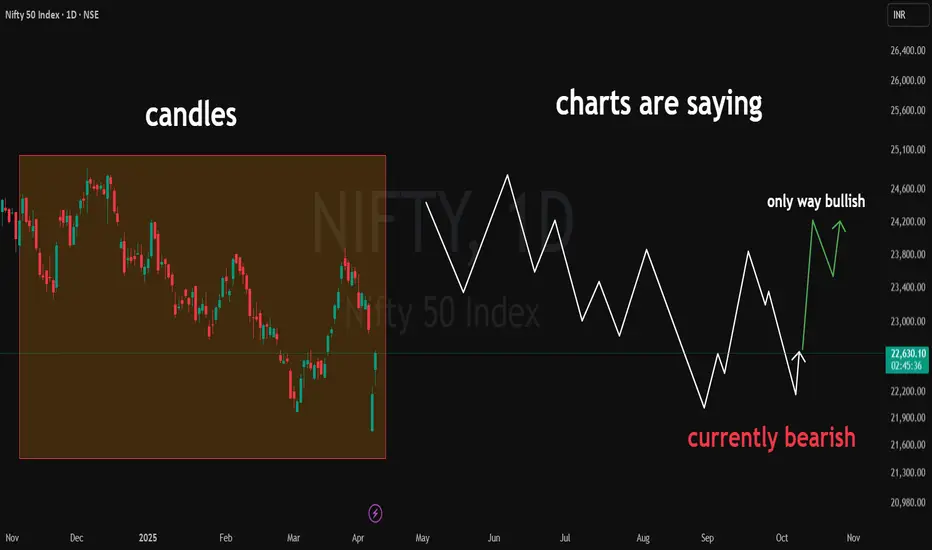
🟧 Daily Chart (1D) – Battle Zone
Price action is noisy but insightful.
We have a potential bullish scenario unfolding — but it’s fragile
Only bullish structure is if price defends recent lows and breaks above resistance in a clean impulse-retrace-impulse fashion.
Despite external triggers like Trump’s tariff announcements, the technical structure across timeframes is telling us one thing:
⚠️ “No bias until structure confirms.”
🟩 Monthly Chart (1M) – The Bigger Picture
The macro trend is nearing a critical MTF decision point.
https://www.tradingview.com/x/8buLqZrB/
🔁 This is the make-or-break zone for the larger structure.
🟥 Weekly Chart (1W) – Bearish Momentum Still in Play
Structure is currently bearish, with lower highs and lower lows.
https://www.tradingview.com/x/IfBUEoDk/
🧠 Key Thought: Don’t assume trend change without structure breaking clearly.
🟧 Daily Chart (1D) – Battle Zone
Price action is noisy but insightful.
We have a potential bullish scenario unfolding — but it’s fragile
Only bullish structure is if price defends recent lows and breaks above resistance in a clean impulse-retrace-impulse fashion.
Despite external triggers like Trump’s tariff announcements, the technical structure across timeframes is telling us one thing:
⚠️ “No bias until structure confirms.”
🎯 Master My Self-Made Trading Strategy
✅ WhatsApp (Learn Today): wa.me/919455664601
📈 Telegram (Learn Today): t.me/hashtaghammer
✅ WhatsApp (Learn Today): wa.me/919455664601
📈 Telegram (Learn Today): t.me/hashtaghammer
Pubblicazioni correlate
Declinazione di responsabilità
Le informazioni ed i contenuti pubblicati non costituiscono in alcun modo una sollecitazione ad investire o ad operare nei mercati finanziari. Non sono inoltre fornite o supportate da TradingView. Maggiori dettagli nelle Condizioni d'uso.