Aggressive Trader can OPT "Protective Call" - trading strategy that contains "Short Future + Long Call (bette near ITM CE)".
This strategy involves short-selling the underlying futures (here NIFTY Future) contract while simultaneously buying a call option (better Near ITM / ATM) on the same underlying asset.
This combination provides limited risk on the upside, as the long call acts as protection if the underlying price rises significantly, effectively capping the potential loss from the short futures position. The position benefits from a bearish or neutral outlook but has limited upside risk due to the long call option.
[Level Interpretation / description:
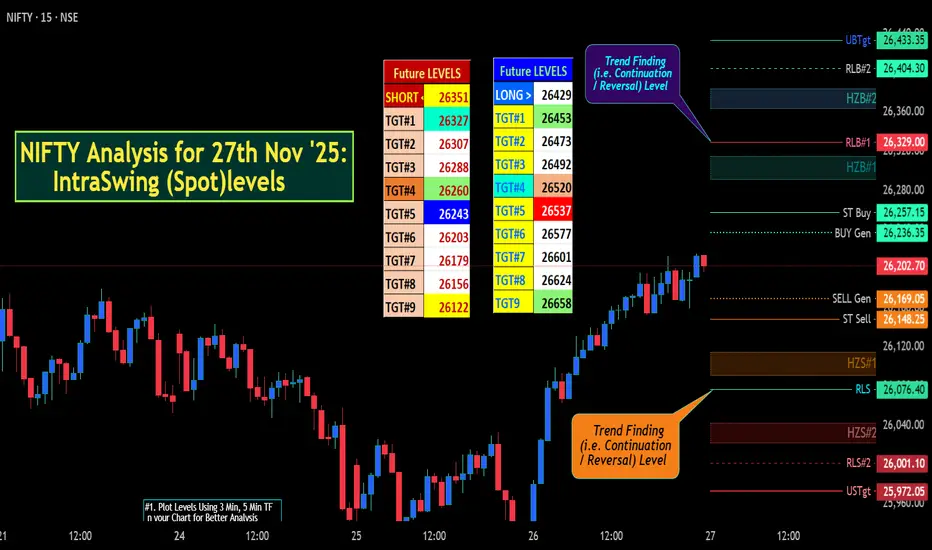
L#1: If the candle crossed & stays above the “Buy Gen”, it is treated / considered as Bullish bias.
L#2: Possibility / Probability of REVERSAL near RLB#1 & UBTgt
L#3: If the candle stays above “Sell Gen” but below “Buy Gen”, it is treated / considered as Sidewise. Aggressive Traders can take Long position near “Sell Gen” either retesting or crossed from Below & vice-versa i.e. can take Short position near “Buy Gen” either retesting or crossed downward from Above.
L#4: If the candle crossed & stays below the “Sell Gen”, it is treated / considered a Bearish bias.
L#5: Possibility / Probability of REVERSAL near RLS#1 & USTgt
HZB (Buy side) & HZS (Sell side) => Hurdle Zone,
*** Specialty of “HZB#1, HZB#2 HZS#1 & HZS#2” is Sidewise (behaviour in Nature)
Rest Plotted and Mentioned on Chart
Color code Used:
Green =. Positive bias.
Red =. Negative bias.
RED in Between Green means Trend Finder / Momentum Change
/ CYCLE Change and Vice Versa.
Notice One thing: HOW LEVELS are Working.
Use any Momentum Indicator / Oscillatoror as you "USED to" to Take entry.
⚠️ DISCLAIMER:
The information, views, and ideas shared here are purely for educational and informational purposes only. They are not intended as investment advice or a recommendation to buy, sell, or hold any financial instruments. I am not a SEBI-registered financial adviser.
Trading and investing in the stock market involves risk, and you should do your own research and analysis. You are solely responsible for any decisions made based on this research.
"As HARD EARNED MONEY IS YOUR's, So DECISION SHOULD HAVE TO BE YOUR's".
Do comment if Helpful.
In depth Analysis will be added later (If time Permits)
Sample Setup Considering Nifty +100 point on 27th Nov 2025.

This strategy involves short-selling the underlying futures (here NIFTY Future) contract while simultaneously buying a call option (better Near ITM / ATM) on the same underlying asset.
This combination provides limited risk on the upside, as the long call acts as protection if the underlying price rises significantly, effectively capping the potential loss from the short futures position. The position benefits from a bearish or neutral outlook but has limited upside risk due to the long call option.
[Level Interpretation / description:
L#1: If the candle crossed & stays above the “Buy Gen”, it is treated / considered as Bullish bias.
L#2: Possibility / Probability of REVERSAL near RLB#1 & UBTgt
L#3: If the candle stays above “Sell Gen” but below “Buy Gen”, it is treated / considered as Sidewise. Aggressive Traders can take Long position near “Sell Gen” either retesting or crossed from Below & vice-versa i.e. can take Short position near “Buy Gen” either retesting or crossed downward from Above.
L#4: If the candle crossed & stays below the “Sell Gen”, it is treated / considered a Bearish bias.
L#5: Possibility / Probability of REVERSAL near RLS#1 & USTgt
HZB (Buy side) & HZS (Sell side) => Hurdle Zone,
*** Specialty of “HZB#1, HZB#2 HZS#1 & HZS#2” is Sidewise (behaviour in Nature)
Rest Plotted and Mentioned on Chart
Color code Used:
Green =. Positive bias.
Red =. Negative bias.
RED in Between Green means Trend Finder / Momentum Change
/ CYCLE Change and Vice Versa.
Notice One thing: HOW LEVELS are Working.
Use any Momentum Indicator / Oscillatoror as you "USED to" to Take entry.
⚠️ DISCLAIMER:
The information, views, and ideas shared here are purely for educational and informational purposes only. They are not intended as investment advice or a recommendation to buy, sell, or hold any financial instruments. I am not a SEBI-registered financial adviser.
Trading and investing in the stock market involves risk, and you should do your own research and analysis. You are solely responsible for any decisions made based on this research.
"As HARD EARNED MONEY IS YOUR's, So DECISION SHOULD HAVE TO BE YOUR's".
Do comment if Helpful.
In depth Analysis will be added later (If time Permits)
Sample Setup Considering Nifty +100 point on 27th Nov 2025.
Nota
Suggested Trade Setup:SHORT NF @ 26460 + Long 26200 CE @ 155
Nota
Breakeven for above mentioned Strategy : 26353,Delta : 40.9
(Delta shows how much the value of a portfolio (strategy) will
theoretically change with a change of underlying asset price by 1 point.)
Nota
Trade activated.Now NF: @ 26460 (Spot: 26278) Premium 182 points.
NF 26250 CE @ 150
Nota
Trade activated.Till Mow:
Now NF: @ 26386 (Spot: 26219) Premium 182 points.
NF 26250 CE @ 108
NF Profit: 26460 - 26386 = 74 point
26250CE Loss: 150-108 = 42 point.
NET Pr: 74 - 42 = > 32 point
Nota
Till Mow:Now NF: @ 26330 (Spot: 26165) Premium 185 points.
NF 26250 CE @ 80
NF Profit: 26460 - 26327 = 133point
26250CE Loss: 150-80 = 70 point.
NET Pr: 133 - 70 = > 63 point
Nota
NIFTY Future made High 26495.6,Mentioned Level TGT #3 26492 (3.6 poinntabove that)
Pubblicazioni correlate
Declinazione di responsabilità
Le informazioni e le pubblicazioni non sono intese come, e non costituiscono, consulenza o raccomandazioni finanziarie, di investimento, di trading o di altro tipo fornite o approvate da TradingView. Per ulteriori informazioni, consultare i Termini di utilizzo.