🔍 Chart Overview
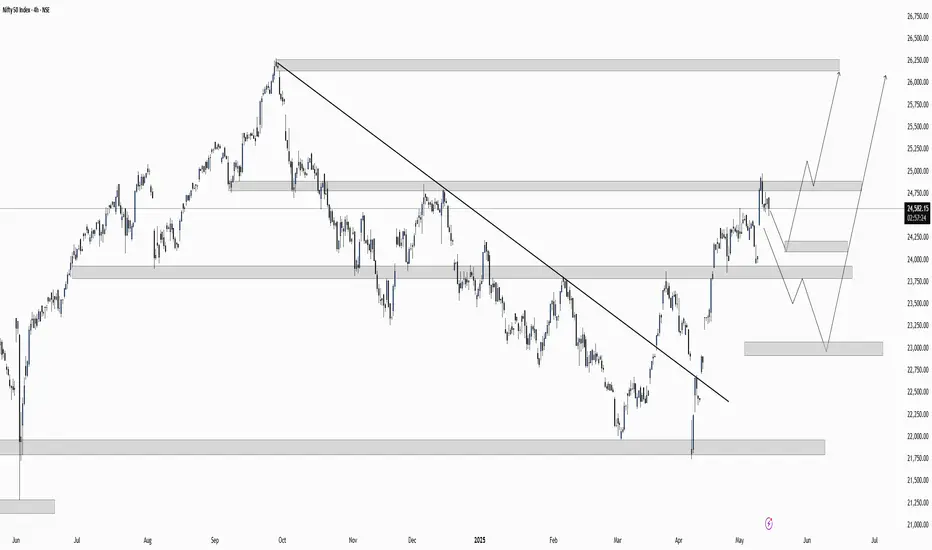
Index: Nifty 50 (NSE)
Timeframe: 4H
Current Price: 24,563.50
Bias: Bullish, but awaiting retracement
🧠 Market Structure Analysis
✅ 1. Trendline Breakout
Long-term descending trendline has been clearly broken, signaling a shift from bearish to bullish structure.
Strong bullish move post-breakout confirms momentum on the buy side.
🧱 2. Key Supply and Demand Zones
Zone Type Price Range Comment
Demand Zone 1 24,150 – 24,300 Strong structure zone, likely to hold on first retest
Demand Zone 2 23,500 – 23,750 Deeper retracement support, highly reactive
Demand Zone 3 22,900 – 23,100 Last stronghold; potential for swing reversal if tested
Supply Zone 25,000 – 25,300 Short-term resistance before bullish continuation
Target Zone 26,250 – 26,500 Next major upside target
🔄 Two Potential Bullish Scenarios Drawn
🅰️ Scenario 1: Shallow Pullback
Retrace to Demand Zone 1 (24,150–24,300)
Bounce and continuation toward 25,000 → 26,000+
Quick retest of structure support → higher high
🅱️ Scenario 2: Deeper Pullback
Break below Zone 1, retest Zone 2 or 3 (as deep as 23,000)
Strong demand and liquidity here could fuel a massive rally toward 26,000
This offers better risk-to-reward for long-term buyers
✅ Bullish Confluences
Signal Description
✅ Trendline Breakout Major signal for bullish reversal
✅ Higher High Formed Structure confirms bulls are in control
✅ Clean Demand Zones Zones are respected and visible
✅ Liquidity Grab Below Potential trap move below 24,000 to grab liquidity before continuation
✅ Fibonacci Confluence Likely overlap with 50–61.8% retracement (not shown, but expected)
❌ Invalidation Level
If price closes below 22,900, it may indicate a breakdown and trend reversal.
Watch for signs of bullish absorption around this level.
📊 Trade Idea: Buy on Dip
Entry Area Stop Loss Target 1 Target 2 Risk:Reward
24,150–24,300 23,950 25,200 26,250 ~1:3
23,500–23,700 23,200 25,200 26,250+ ~1:4
Disclaimer:
The information provided in this post/video/chart is for educational and informational purposes only. It should not be considered financial advice or a recommendation to buy or sell any security, financial product, or instrument.
I am not a SEBI-registered investment advisor. All trading and investing decisions are at your own risk. Past performance does not guarantee future results. Always consult with a qualified financial advisor before making any financial decisions.
Declinazione di responsabilità
Le informazioni ed i contenuti pubblicati non costituiscono in alcun modo una sollecitazione ad investire o ad operare nei mercati finanziari. Non sono inoltre fornite o supportate da TradingView. Maggiori dettagli nelle Condizioni d'uso.
Declinazione di responsabilità
Le informazioni ed i contenuti pubblicati non costituiscono in alcun modo una sollecitazione ad investire o ad operare nei mercati finanziari. Non sono inoltre fornite o supportate da TradingView. Maggiori dettagli nelle Condizioni d'uso.