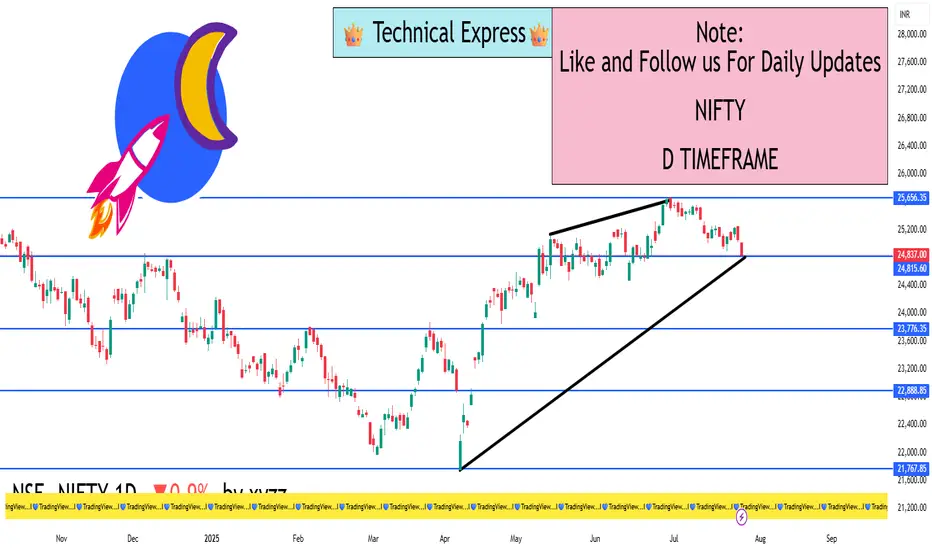
Closing Price: ₹24,837.00
Daily Change: −0.90% (about 225 points down)
Day’s Range: ₹24,806 – ₹25,010
Volume: Moderate to slightly higher than average
Market Sentiment: Cautiously Bearish
🔍 1D Price Action Summary
The 1-day chart of Nifty shows weakness near a key resistance zone. The index has been trading in a downward-sloping range over the past few sessions. The day began with mild strength but selling pressure pushed the index down by the close.
Bearish candlestick formation with a relatively long upper wick, indicating rejection near intraday highs.
4th consecutive day of weakness, hinting at profit booking and lower highs on the chart.
The price closed near the day’s low, suggesting bearish momentum could carry into the next session.
📐 Technical Levels
✅ Support Zones
Primary Support: ₹24,800 – This level has been tested multiple times recently. A close below it could trigger further downside.
Secondary Support: ₹24,550 – Considered a swing low from earlier this month.
Major Support: ₹24,250 – The breakout level from the previous consolidation.
❌ Resistance Zones
Immediate Resistance: ₹25,050 – This was the intraday high and rejected.
Stronger Resistance: ₹25,250 – Previously a strong support zone, now turned resistance.
Major Resistance: ₹25,500 – All-time high zone; bulls will need strength to retest this.
📊 Trend Analysis
Current Trend: Short-Term Bearish
Medium-Term Trend: Neutral to Slightly Bullish
200-DMA (Daily Moving Average): Nifty is trading above the 200-DMA, keeping the long-term trend intact.
50-DMA: Price is nearing the 50-day moving average. A break below could accelerate selling pressure.
📈 Chart Patterns Observed
Head and Shoulders Pattern (Forming): The right shoulder is under formation; neckline lies near ₹24,800. Breakdown could trigger a short-term fall of 200–300 points.
Bearish Engulfing Candlestick (on the daily): Indicates aggressive seller dominance.
Lower Highs and Lower Lows: A sign of short-term downtrend.
🧠 Institutional & Retail Activity
FIIs (Foreign Institutional Investors): Net sellers over the past few sessions. Sentiment cautious due to global macro uncertainty.
DIIs (Domestic Institutions): Providing some support on dips, but not aggressively buying.
Retail Traders: More active in options and short-term plays; volatility increasing.
💡 Trading Strategy Ideas (Short-Term)
🔻 For Bears (Short-Side Traders)
Consider short positions below ₹24,800 with targets around ₹24,550–24,400.
Use strict stop-loss above ₹25,050 to manage risk.
Bearish bias valid until the price closes above ₹25,250.
🔼 For Bulls (Dip Buyers)
Watch for price action around ₹24,800–24,550 for signs of reversal.
Ideal scenario: bullish engulfing candle or bullish divergence on RSI.
Avoid aggressive buying unless the index reclaims ₹25,250.
🕯️ Candle Psychology Summary
The market opened near flat, tried to move higher, but was met with consistent selling.
This created a long upper wick – a sign that bulls lost control quickly.
The close near the low signals sellers had the upper hand all day.
🚨 Key Takeaways
Nifty is under pressure with key support at ₹24,800 in focus.
A breakdown below this level could drag the index to ₹24,550 or even lower.
Bulls must reclaim ₹25,250 to shift momentum in their favor.
RSI and MACD show weakness, but Stochastic hints a possible oversold bounce soon.
Volatility remains high; risk management is critical.
I built a Buy & Sell Signal Indicator with 85% accuracy.
📈 Get access via DM or
WhatsApp: wa.link/d997q0
| Email: techncialexpress@gmail.com
| Script Coder | Trader | Investor | From India
📈 Get access via DM or
WhatsApp: wa.link/d997q0
| Email: techncialexpress@gmail.com
| Script Coder | Trader | Investor | From India
Pubblicazioni correlate
Declinazione di responsabilità
Le informazioni ed i contenuti pubblicati non costituiscono in alcun modo una sollecitazione ad investire o ad operare nei mercati finanziari. Non sono inoltre fornite o supportate da TradingView. Maggiori dettagli nelle Condizioni d'uso.