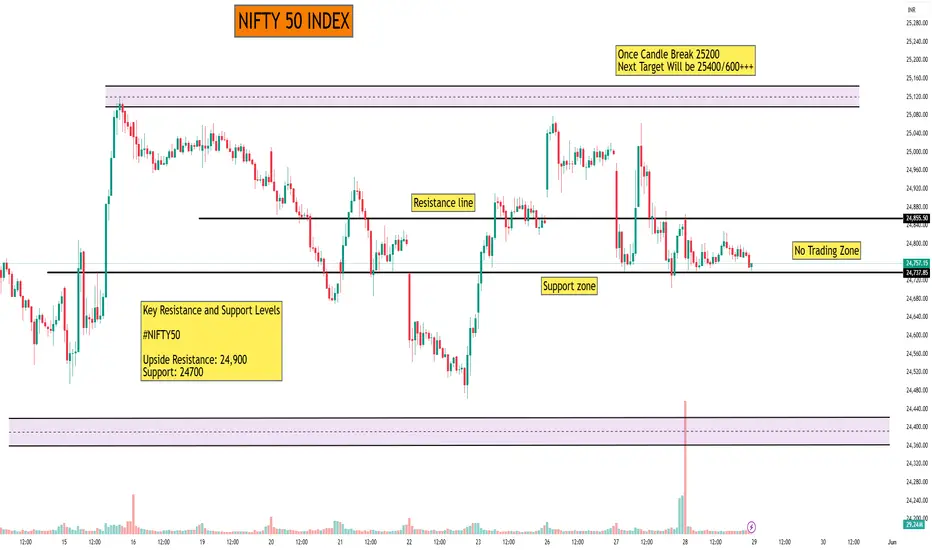
As of May 29, 2025, the Nifty 50 Index is trading at 24,752.45, reflecting a 0.00% change from the previous close.
📊 15-Minute Support & Resistance Levels (Classic Pivot Points)
Based on the latest technical analysis, the key support and resistance levels for the Nifty 50 Index on a 15-minute timeframe are:
Support Levels:
S1: 24,784.57
S2: 24,704.93
S3: 24,657.47
Resistance Levels:
R1: 24,911.67
R2: 24,959.13
R3: 25,038.77
These levels are derived from the price range of the previous trading day.
🔍 Market Sentiment
The technical indicators suggest that the Nifty 50 Index is currently in a consolidation phase. Traders should monitor the support and resistance levels closely for potential breakout or pullback scenarios. A sustained move above the resistance levels may indicate bullish momentum, while a drop below the support levels could signal bearish sentiment.
Please note that stock market investments are subject to market risks, and it's essential to conduct thorough research or consult with a financial advisor before making investment decisions.
I built a Buy & Sell Signal Indicator with 85% accuracy.
📈 Get access via DM or
WhatsApp: wa.link/d997q0
| Email: techncialexpress@gmail.com
| Script Coder | Trader | Investor | From India
📈 Get access via DM or
WhatsApp: wa.link/d997q0
| Email: techncialexpress@gmail.com
| Script Coder | Trader | Investor | From India
Pubblicazioni correlate
Declinazione di responsabilità
Le informazioni ed i contenuti pubblicati non costituiscono in alcun modo una sollecitazione ad investire o ad operare nei mercati finanziari. Non sono inoltre fornite o supportate da TradingView. Maggiori dettagli nelle Condizioni d'uso.