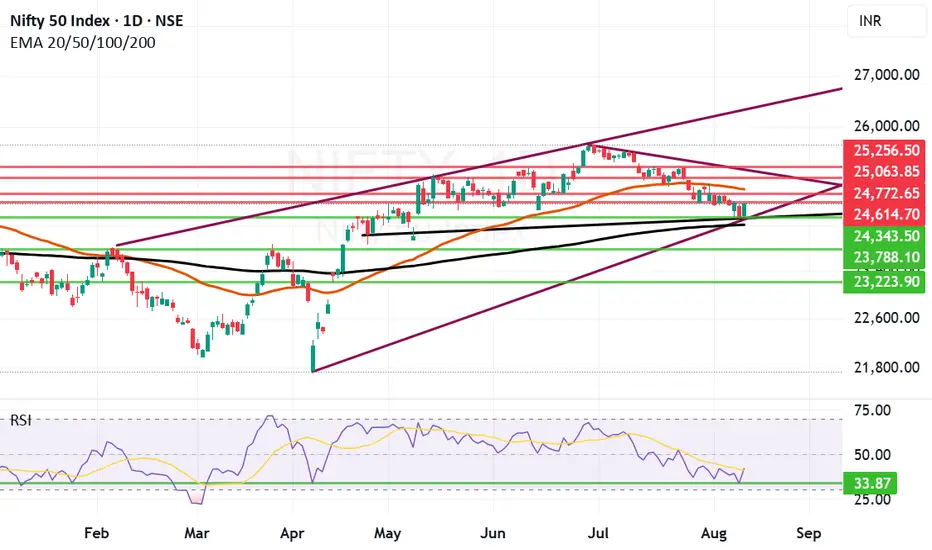
We saw a good comeback and bounce by Nifty from a Technical RSI support zone which is around 33. We can by no means call this start of a Bull rally as of now. For Bull Rally to sustain we need a closing on Nifty above 24842. In such a scenario if we get a closing above 24842 the Bulls will feel comfortable. Bulls can breath easy only after we get a closing above 25256 zone. Above 25256 the Bulls can take control of the market. With Nuclear threats flowing around and still Tariff related issues prevailing it looks difficult for Bulls to take proper control of the market. The bounce we saw today can be credited to few reasons mentioned below:
1) Government announcement to support the sectors that will be most affected by Tariffs.
2) Some noises from within the Government to increase the spending to compensate for the GDP loss due to Tariff situation.
3) Silver lining in the clouds which are showing due to the upcoming Trump-Putin talks, Indian PM's proposed China visit.
4) RBI has allowed Indian banks to open special Vostro accounts to facilitate international trade settlements. (However if this has built positive sentiment is something which is yet to be fully understood). Also I am not an expert to understand the framework under which these accounts will work or how it will benefit our companies is a matter of economic experts to study.
With all this buildup the supports for Nifty remain at: 24343 and 24204. Below 24204 closing or weekly closing the Bears will take total control of the market and drag Nifty below 24K towards 23788 or 23223. Most important support remains at 24204 (Father line Support of Daily charts).
Nifty Resistances remain at: 24614, 24772, 25063 and finally 25256. Above 25256 Bulls can take control of the market and we will comment above further levels when we get there.
Disclaimer: The above information is provided for educational purpose, analysis and paper trading only. Please don't treat this as a buy or sell recommendation for the stock or index. The Techno-Funda analysis is based on data that is more than 3 months old. Supports and Resistances are determined by historic past peaks and Valley in the chart. Many other indicators and patterns like EMA, RSI, MACD, Volumes, Fibonacci, parallel channel etc. use historic data which is 3 months or older cyclical points. There is no guarantee they will work in future as markets are highly volatile and swings in prices are also due to macro and micro factors based on actions taken by the company as well as region and global events. Equity investment is subject to risks. I or my clients or family members might have positions in the stocks that we mention in our educational posts. We will not be responsible for any Profit or loss that may occur due to any financial decision taken based on any data provided in this message. Do consult your investment advisor before taking any financial decisions. Stop losses should be an important part of any investment in equity.
Declinazione di responsabilità
Le informazioni ed i contenuti pubblicati non costituiscono in alcun modo una sollecitazione ad investire o ad operare nei mercati finanziari. Non sono inoltre fornite o supportate da TradingView. Maggiori dettagli nelle Condizioni d'uso.
Declinazione di responsabilità
Le informazioni ed i contenuti pubblicati non costituiscono in alcun modo una sollecitazione ad investire o ad operare nei mercati finanziari. Non sono inoltre fornite o supportate da TradingView. Maggiori dettagli nelle Condizioni d'uso.