📊 NVDA – Multi-Timeframe Outlook
🔎 Monthly (1M)
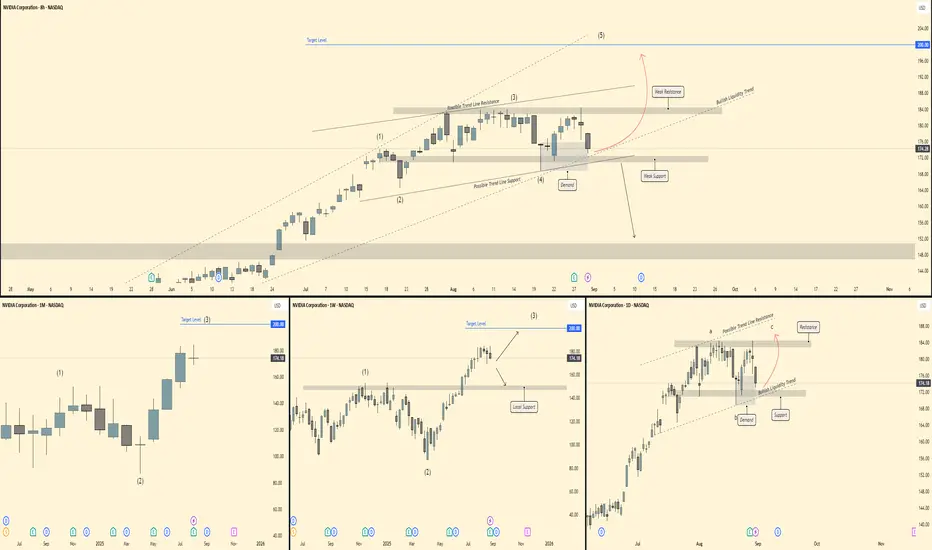
Strong bullish structure with clear Elliott Wave progression (1)-(3) unfolding.
Current candle shows retracement after a parabolic push, but higher timeframe structure remains intact.
Target level stands at 200 USD, aligning with Wave (3) completion zone.
🕰 Weekly (1W)
NVDA completed Wave (3) near 184, now pulling back into a local support zone ~160 – 165.
Structure suggests a corrective Wave (4) before potential continuation higher.
As long as support holds, expectation remains for a Wave (5) push towards 200+.
⏱ Daily (1D)
Price coiling inside a corrective a-b-c structure under trendline resistance.
Demand/support zone ~170 – 172 is acting as the base.
Break above 184 resistance confirms bullish continuation, while loss of support opens risk towards 152 (deeper retrace).
⏳ 8H
Clear retracement into demand after Wave (3) high.
Price holding trendline support + demand confluence.
If buyers step in, expect a rally into Wave (5) targeting 190 – 200.
Breakdown of demand would shift momentum bearish short-term.
🎯 Trade Plan
Bias: Bullish continuation (Wave 5 setup)
Entry Zone: 170 – 175 (demand/support)
Targets: 184 (short-term), 200 (medium-term)
Invalidation: Break & close below 160 support
🔎 Monthly (1M)
Strong bullish structure with clear Elliott Wave progression (1)-(3) unfolding.
Current candle shows retracement after a parabolic push, but higher timeframe structure remains intact.
Target level stands at 200 USD, aligning with Wave (3) completion zone.
🕰 Weekly (1W)
NVDA completed Wave (3) near 184, now pulling back into a local support zone ~160 – 165.
Structure suggests a corrective Wave (4) before potential continuation higher.
As long as support holds, expectation remains for a Wave (5) push towards 200+.
⏱ Daily (1D)
Price coiling inside a corrective a-b-c structure under trendline resistance.
Demand/support zone ~170 – 172 is acting as the base.
Break above 184 resistance confirms bullish continuation, while loss of support opens risk towards 152 (deeper retrace).
⏳ 8H
Clear retracement into demand after Wave (3) high.
Price holding trendline support + demand confluence.
If buyers step in, expect a rally into Wave (5) targeting 190 – 200.
Breakdown of demand would shift momentum bearish short-term.
🎯 Trade Plan
Bias: Bullish continuation (Wave 5 setup)
Entry Zone: 170 – 175 (demand/support)
Targets: 184 (short-term), 200 (medium-term)
Invalidation: Break & close below 160 support
Declinazione di responsabilità
Le informazioni ed i contenuti pubblicati non costituiscono in alcun modo una sollecitazione ad investire o ad operare nei mercati finanziari. Non sono inoltre fornite o supportate da TradingView. Maggiori dettagli nelle Condizioni d'uso.
Declinazione di responsabilità
Le informazioni ed i contenuti pubblicati non costituiscono in alcun modo una sollecitazione ad investire o ad operare nei mercati finanziari. Non sono inoltre fornite o supportate da TradingView. Maggiori dettagli nelle Condizioni d'uso.