After being locked in a severe bear market since its 2021 IPO, UI Path (PATH) has just delivered its most significant bullish signal to date. An explosive, high-volume breakout this past week suggests its multi-year basing phase may be complete and a new major uptrend is beginning.
The Long-Term Bottoming Process
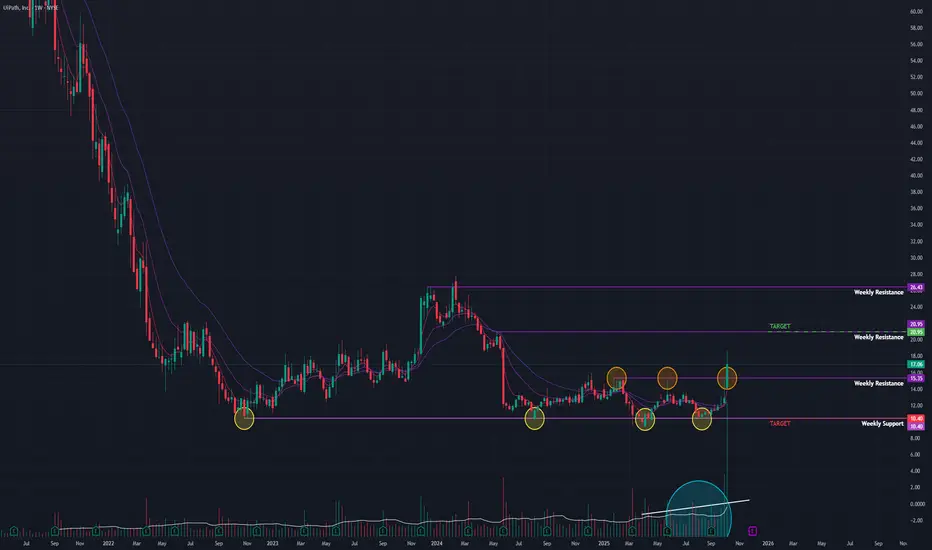
Following its IPO in April 2021, UI Path entered a protracted downtrend. The stock finally stopped making new lows in October 2022, transitioning into a multi-year sideways consolidation range. This long basing period is often where accumulation occurs, setting the stage for a potential trend reversal.
This Week's Explosive Breakout
The week ending Friday, October 10, 2025, marked a dramatic shift in character for the stock:
- Monumental Weekly Gain: The stock skyrocketed by an incredible +32.21%.
- Enormous Volume: This move was validated by a massive trading volume of 366.81 million shares, indicating powerful institutional buying.
- Major Resistance Breach: The surge shattered a key resistance level that had capped prices for the duration of its multi-year consolidation.
This powerful price action has flipped the short-term Exponential Moving Averages (EMAs) into a bullish positive crossover. Concurrently, the Relative Strength Index (RSI) is now strongly rising on both the Monthly and Weekly charts, confirming a significant shift in long-term momentum.
Outlook and Key Levels
The breakout from a multi-year base is a technically powerful event that could define the stock's direction for months to come.
- Bullish Target: If this newfound momentum is sustained, the next major area of resistance and potential target is the $21 level.
- Critical Support: In case of a pullback, the breakout zone around the $10 level is now the most critical new support. A failure to hold this level would invalidate the bullish signal.
This week's action represents a significant technical turning point for UI Path. The key now is to watch for follow-through buying or a successful retest of the $15.35 breakout level to confirm the start of a new, sustained uptrend.
The Long-Term Bottoming Process
Following its IPO in April 2021, UI Path entered a protracted downtrend. The stock finally stopped making new lows in October 2022, transitioning into a multi-year sideways consolidation range. This long basing period is often where accumulation occurs, setting the stage for a potential trend reversal.
This Week's Explosive Breakout
The week ending Friday, October 10, 2025, marked a dramatic shift in character for the stock:
- Monumental Weekly Gain: The stock skyrocketed by an incredible +32.21%.
- Enormous Volume: This move was validated by a massive trading volume of 366.81 million shares, indicating powerful institutional buying.
- Major Resistance Breach: The surge shattered a key resistance level that had capped prices for the duration of its multi-year consolidation.
This powerful price action has flipped the short-term Exponential Moving Averages (EMAs) into a bullish positive crossover. Concurrently, the Relative Strength Index (RSI) is now strongly rising on both the Monthly and Weekly charts, confirming a significant shift in long-term momentum.
Outlook and Key Levels
The breakout from a multi-year base is a technically powerful event that could define the stock's direction for months to come.
- Bullish Target: If this newfound momentum is sustained, the next major area of resistance and potential target is the $21 level.
- Critical Support: In case of a pullback, the breakout zone around the $10 level is now the most critical new support. A failure to hold this level would invalidate the bullish signal.
This week's action represents a significant technical turning point for UI Path. The key now is to watch for follow-through buying or a successful retest of the $15.35 breakout level to confirm the start of a new, sustained uptrend.
Disclaimer: This analysis is my personal view & for educational purposes only. They shall not be construed as trade or investment advice. Before making any financial decision, it is imperative that you consult with a qualified financial professional.
Declinazione di responsabilità
Le informazioni e le pubblicazioni non sono intese come, e non costituiscono, consulenza o raccomandazioni finanziarie, di investimento, di trading o di altro tipo fornite o approvate da TradingView. Per ulteriori informazioni, consultare i Termini di utilizzo.