KOTAK PSU BANK Stock Analysis: Current Market Phase
Step 1: Chart Analysis & Price Action Assessment
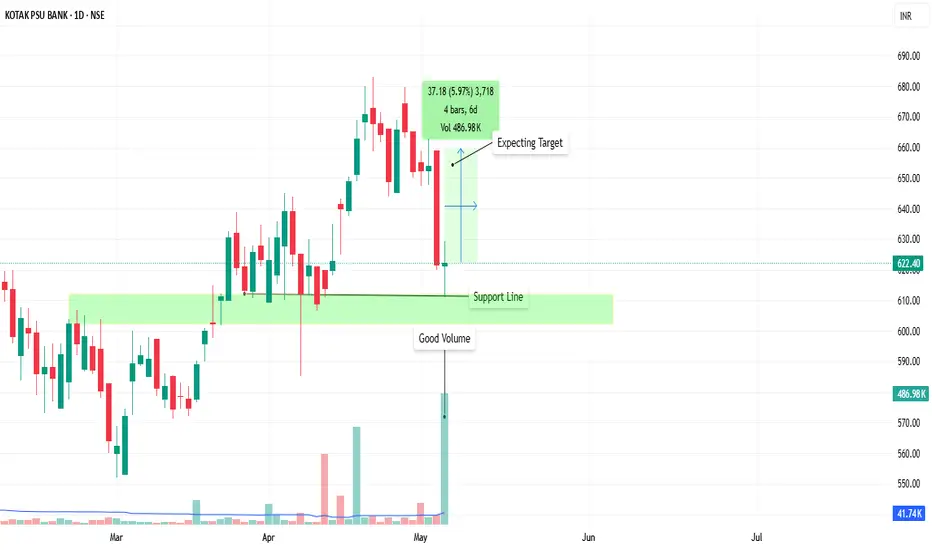
The stock has shown a strong uptrend since mid-March 2025, moving from ₹580 to recent highs around ₹670
Recent price action shows a sharp pullback with a large red candle, followed by stabilization
Current price: ₹622.40 (-0.84, +0.14%)
The chart shows a prior support level around ₹620-625 where the price appears to be finding buyers
The recent pullback has retraced approximately 50% of the prior uptrend
Price pattern shows a recent higher low compared to the March-April period
Step 2: Volume & Volatility Analysis
Current volume (486.98K) is significantly higher than the 50-day average (41.74K)
A substantial volume spike accompanied the recent pullback, indicating high participation
The chart notation indicates "Good Volume" on May 7th
Volatility increased during the recent pullback with larger price bars
The stock has been displaying above-average volatility since mid-April
Step 3: Phase Classification
KOTAK PSU BANK is currently in Stage 2: Accumulation Phase (pullback within uptrend)
Supporting evidence:
The stock was in a clear uptrend before the recent pullback
Current price action suggests stabilization at support levels
High volume during pullback often indicates climactic selling followed by accumulation
Price has held above previous support levels despite the sharp decline
The chart includes annotations suggesting an "Expecting Target" above current levels
Step 4: Final Summary & Recommended Action
Key Observations:
Trend Direction: Primary uptrend with recent pullback
Volume Behavior: High volume during pullback suggesting potential selling climax
Volatility: Increased but stabilizing at support level
Support & Resistance: Support around ₹620-625, resistance at previous high ₹670-675
Suggested Strategy:
Since KOTAK PSU BANK is in Stage 2 (Accumulation following pullback):
Consider this pullback as a potential buying opportunity within the broader uptrend
Look for signs of stabilization and reversal at current support levels
Monitor volume patterns for confirmation of renewed buying interest
Final Action Plan:
BUY on confirmation of support hold with a small position
Add to position if price moves above recent consolidation with increasing volume
Set stop-loss below the recent low (approximately ₹615)
Target the previous high of ₹670-675 as initial profit objective
Monitor volume closely - increasing volume on up days would confirm resumption of uptrend
Watch for a potential "higher low" formation which would strengthen the bullish case
The chart annotation indicates a target expectation higher than previous levels - this suggests potential for continuation of the primary uptrend
This pullback within a broader uptrend presents a potential opportunity with well-defined risk parameters. The high volume during the pullback could indicate a selling climax, setting the stage for the next leg up if support holds.
Step 1: Chart Analysis & Price Action Assessment
The stock has shown a strong uptrend since mid-March 2025, moving from ₹580 to recent highs around ₹670
Recent price action shows a sharp pullback with a large red candle, followed by stabilization
Current price: ₹622.40 (-0.84, +0.14%)
The chart shows a prior support level around ₹620-625 where the price appears to be finding buyers
The recent pullback has retraced approximately 50% of the prior uptrend
Price pattern shows a recent higher low compared to the March-April period
Step 2: Volume & Volatility Analysis
Current volume (486.98K) is significantly higher than the 50-day average (41.74K)
A substantial volume spike accompanied the recent pullback, indicating high participation
The chart notation indicates "Good Volume" on May 7th
Volatility increased during the recent pullback with larger price bars
The stock has been displaying above-average volatility since mid-April
Step 3: Phase Classification
KOTAK PSU BANK is currently in Stage 2: Accumulation Phase (pullback within uptrend)
Supporting evidence:
The stock was in a clear uptrend before the recent pullback
Current price action suggests stabilization at support levels
High volume during pullback often indicates climactic selling followed by accumulation
Price has held above previous support levels despite the sharp decline
The chart includes annotations suggesting an "Expecting Target" above current levels
Step 4: Final Summary & Recommended Action
Key Observations:
Trend Direction: Primary uptrend with recent pullback
Volume Behavior: High volume during pullback suggesting potential selling climax
Volatility: Increased but stabilizing at support level
Support & Resistance: Support around ₹620-625, resistance at previous high ₹670-675
Suggested Strategy:
Since KOTAK PSU BANK is in Stage 2 (Accumulation following pullback):
Consider this pullback as a potential buying opportunity within the broader uptrend
Look for signs of stabilization and reversal at current support levels
Monitor volume patterns for confirmation of renewed buying interest
Final Action Plan:
BUY on confirmation of support hold with a small position
Add to position if price moves above recent consolidation with increasing volume
Set stop-loss below the recent low (approximately ₹615)
Target the previous high of ₹670-675 as initial profit objective
Monitor volume closely - increasing volume on up days would confirm resumption of uptrend
Watch for a potential "higher low" formation which would strengthen the bullish case
The chart annotation indicates a target expectation higher than previous levels - this suggests potential for continuation of the primary uptrend
This pullback within a broader uptrend presents a potential opportunity with well-defined risk parameters. The high volume during the pullback could indicate a selling climax, setting the stage for the next leg up if support holds.
Trade attivo
Almost Target hit. What we need morethan thatDeclinazione di responsabilità
Le informazioni ed i contenuti pubblicati non costituiscono in alcun modo una sollecitazione ad investire o ad operare nei mercati finanziari. Non sono inoltre fornite o supportate da TradingView. Maggiori dettagli nelle Condizioni d'uso.
Declinazione di responsabilità
Le informazioni ed i contenuti pubblicati non costituiscono in alcun modo una sollecitazione ad investire o ad operare nei mercati finanziari. Non sono inoltre fornite o supportate da TradingView. Maggiori dettagli nelle Condizioni d'uso.