SCB | Wave Projection | Pullback Trade @ Bullish Pennant Support
Price action and chart pattern trading:
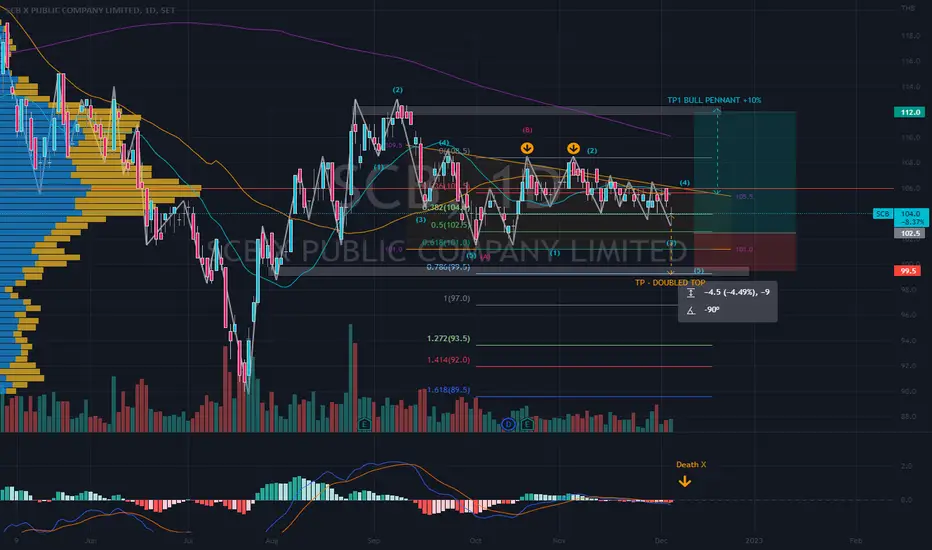
> An possible ABC correction scenario with bullish pennant pattern or descending triangle
> The price currently SMA20 crossing below SMA50 with MACD crossing down bearish support indicator
> PULLBACK TRADE @ bullish pennant support level at a further breakdown with local doubled top pattern targeting -4.5% downside to fibonanci 0.786 extension of previous A-wave support level.
> Risk Reward Ratio 3:1
Always trade with affordable risk and respect your stoploss!
Trade chiuso: obiettivo raggiunto
Enjoyed the profit, now a possible long entry position -wait for confirmation breakout in smaller timeframe - the price is trading at the ascending triangle support: Declinazione di responsabilità
Le informazioni ed i contenuti pubblicati non costituiscono in alcun modo una sollecitazione ad investire o ad operare nei mercati finanziari. Non sono inoltre fornite o supportate da TradingView. Maggiori dettagli nelle Condizioni d'uso.
Declinazione di responsabilità
Le informazioni ed i contenuti pubblicati non costituiscono in alcun modo una sollecitazione ad investire o ad operare nei mercati finanziari. Non sono inoltre fornite o supportate da TradingView. Maggiori dettagli nelle Condizioni d'uso.