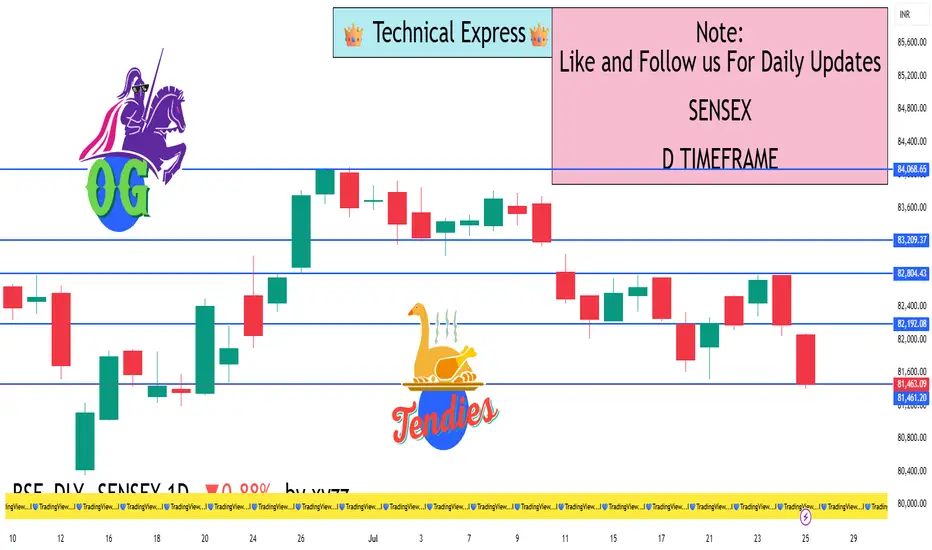
Closing Value: 81,463.09
Net Change: −721.08 points (−0.88%)
Opening Level: 82,065.76
Day’s High: 82,069.51
Day’s Low: 81,397.69
Trend: Bearish
📊 Technical Analysis:
✅ Candle Type:
Large bearish candle with a close near the day’s low.
Indicates strong selling pressure throughout the session.
🔻 Support Levels:
81,400 – Immediate support (Friday’s low)
81,000 – Critical psychological and technical level
80,700 – Medium-term support zone
🔺 Resistance Levels:
82,070 – Intraday high and near-term resistance
82,300 – Minor resistance
82,500 – Strong resistance zone
📈 Indicator Summary:
RSI (Relative Strength Index): Likely below 50 – shows weakening buying strength
MACD: Bearish crossover – confirms ongoing downtrend
Volume: Higher than average – selling was broad-based and strong
🧠 Market Sentiment:
Bearish sentiment due to pressure in Auto, Banking, Energy, and IT sectors
Major stocks pulling down the index: Reliance, HDFC Bank, Infosys, Tech Mahindra, and Bajaj Finance
Investors showed caution amid FII selling, weak global signals, and earnings season pressure
✅ Conclusion:
Sensex is in a short-term downtrend
A breakdown below 81,000 could trigger a move toward 80,700 or lower
Bulls must reclaim 82,000–82,300 levels to regain positive momentum
I built a Buy & Sell Signal Indicator with 85% accuracy.
📈 Get access via DM or
WhatsApp: wa.link/d997q0
| Email: techncialexpress@gmail.com
| Script Coder | Trader | Investor | From India
📈 Get access via DM or
WhatsApp: wa.link/d997q0
| Email: techncialexpress@gmail.com
| Script Coder | Trader | Investor | From India
Pubblicazioni correlate
Declinazione di responsabilità
Le informazioni ed i contenuti pubblicati non costituiscono in alcun modo una sollecitazione ad investire o ad operare nei mercati finanziari. Non sono inoltre fornite o supportate da TradingView. Maggiori dettagli nelle Condizioni d'uso.