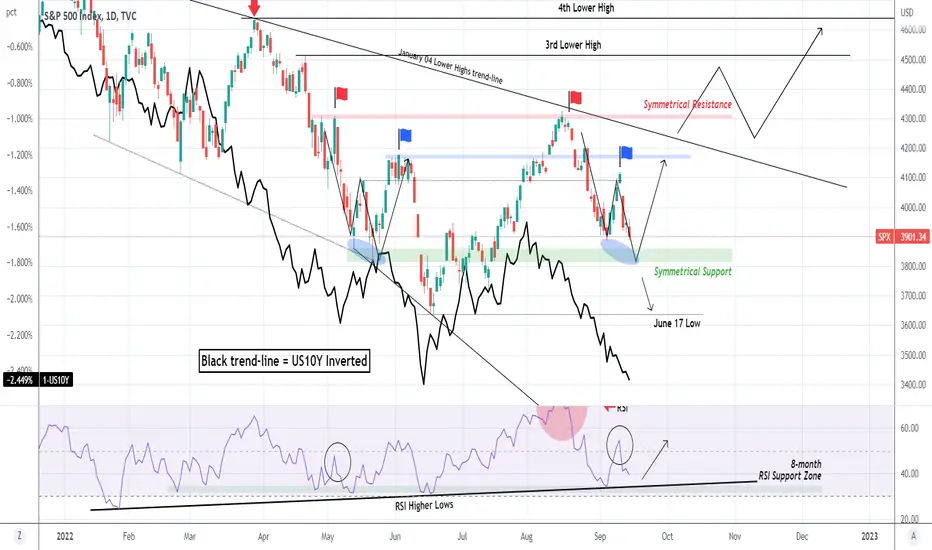
The S&P500 index (SPX) got sold off aggressively on Monday after a worse than expected CPI report. The price action since the August 16 High appears to be repeating the trading sequence of last May. As you see it seems to be a W structure that pivots off Symmetrical Support and Resistance levels, at least so far. If completed that means that the price should rebound on the lower Symmetrical Support Zone and hit the blue pivot before getting aggressively rejected to a new Low.
Can this new projected sell-off into October be avoided? Yes but if and only if the following set of parameters is met:
* Firstly the 1D RSI rebounds on its Higher Lows trend-line and NOT its 8-month Support Zone and
* Secondly if the US10Y, which on this chart is represented by its inverted shape of the 1-US10Y symbol (black trend-line) for better comparison purposes, pivots off its June 14 Low. As you see that rebound was what started the June 17 - August 16 two-month rally on the stock market.
--------------------------------------------------------------------------------------------------------
** Please support this idea with your likes and comments, it is the best way to keep it relevant and support me. **
--------------------------------------------------------------------------------------------------------
👑Best Signals (Forex/Crypto+70% accuracy) & Account Management (+20% profit/month on 10k accounts)
💰Free Channel t.me/tradingshotglobal
🤵Contact info@tradingshot.com t.me/tradingshot
🔥New service: next X100 crypto GEMS!
💰Free Channel t.me/tradingshotglobal
🤵Contact info@tradingshot.com t.me/tradingshot
🔥New service: next X100 crypto GEMS!
Declinazione di responsabilità
Le informazioni ed i contenuti pubblicati non costituiscono in alcun modo una sollecitazione ad investire o ad operare nei mercati finanziari. Non sono inoltre fornite o supportate da TradingView. Maggiori dettagli nelle Condizioni d'uso.
