📊 S&P 500 Wave Analysis Update
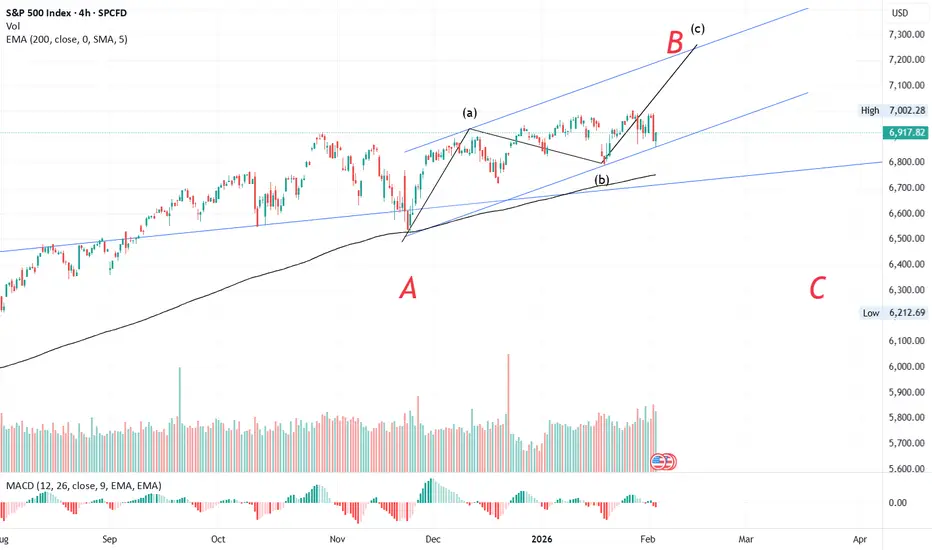
The S&P began its corrective phase on 29 Oct 2025, forming its A wave by 21 Nov 2025. From there, the index rallied into its B wave, retracing more than 61.8%, which signals the development of a flat correction.
Breaking down the B wave:
- The a wave formed on 5 Dec 2025.
- The subsequent b wave retraced less than 61.8%, indicating a zig-zag structure.
- This sets the stage for the c wave, which has the potential to extend towards the 7200–7300 zone.
Pubblicazioni correlate
Declinazione di responsabilità
Le informazioni e le pubblicazioni non sono intese come, e non costituiscono, consulenza o raccomandazioni finanziarie, di investimento, di trading o di altro tipo fornite o approvate da TradingView. Per ulteriori informazioni, consultare i Termini di utilizzo.