A comprehensive multi-timeframe VPA analysis of SPY reveals a market at a critical inflection point, making a 'wait and see' approach the most prudent strategy for a trend trader.
**Weekly Chart (Long-Term View):** The primary trend is clearly bullish, defined by a strong ascending trendline active for several months. However, the price is currently stalling at a major horizontal resistance level around $685. The most recent weekly candle is a spinning top/doji with a prominent upper wick, indicating that supply is emerging at this level and sellers are rejecting higher prices. This is a sign of indecision and potential exhaustion after a long run-up.
**Daily Chart (Medium-Term View):** The daily chart confirms the consolidation below the ~$685 resistance. A key VPA signal is present: the rally from the mid-November low back to this resistance has occurred on noticeably declining volume. This is a classic 'No Demand' signal, suggesting a lack of conviction and participation from professional money to push prices through this supply zone. While the sharp sell-off in mid-November was met with very high 'Stopping Volume' (a sign of professional absorption/accumulation), the subsequent rally lacks the volume signature of strength.
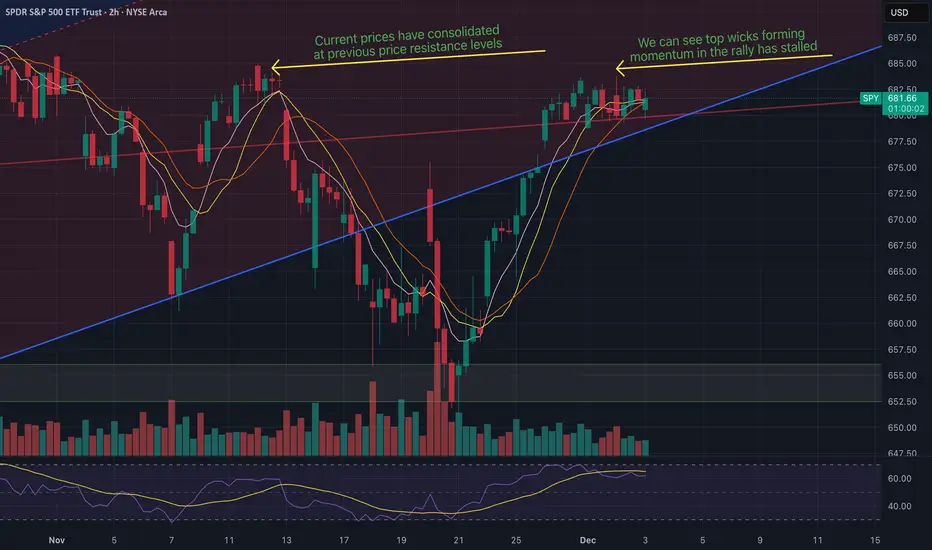
**4-Hour Chart (Short-Term View):** This timeframe shows the price action coiling into an ascending triangle pattern, bounded by the ascending trendline support and the horizontal resistance. While an ascending triangle is typically a bullish continuation pattern, the volume has been diminishing throughout its formation. This confirms the 'No Demand' seen on the daily chart and indicates the market is in equilibrium, awaiting a catalyst.
**Conclusion:** Professional money showed its hand by absorbing the selling pressure in mid-November (bullish background). However, they are now showing a clear lack of interest in buying aggressively at these higher prices, right below significant resistance. The trend is mature and showing signs of weakness. A trend trader should not enter a new long position directly under a major supply level with evidence of 'No Demand'. The risk of a 'false breakout' or a breakdown is elevated. The recommendation is to wait for a decisive move: a high-volume breakout above $686 would signal a continuation and a potential buy entry, while a high-volume breakdown below the ascending trendline (approx. $680) would signal a reversal and a potential sell entry. Until then, the risk/reward is unfavorable.
**Weekly Chart (Long-Term View):** The primary trend is clearly bullish, defined by a strong ascending trendline active for several months. However, the price is currently stalling at a major horizontal resistance level around $685. The most recent weekly candle is a spinning top/doji with a prominent upper wick, indicating that supply is emerging at this level and sellers are rejecting higher prices. This is a sign of indecision and potential exhaustion after a long run-up.
**Daily Chart (Medium-Term View):** The daily chart confirms the consolidation below the ~$685 resistance. A key VPA signal is present: the rally from the mid-November low back to this resistance has occurred on noticeably declining volume. This is a classic 'No Demand' signal, suggesting a lack of conviction and participation from professional money to push prices through this supply zone. While the sharp sell-off in mid-November was met with very high 'Stopping Volume' (a sign of professional absorption/accumulation), the subsequent rally lacks the volume signature of strength.
**4-Hour Chart (Short-Term View):** This timeframe shows the price action coiling into an ascending triangle pattern, bounded by the ascending trendline support and the horizontal resistance. While an ascending triangle is typically a bullish continuation pattern, the volume has been diminishing throughout its formation. This confirms the 'No Demand' seen on the daily chart and indicates the market is in equilibrium, awaiting a catalyst.
**Conclusion:** Professional money showed its hand by absorbing the selling pressure in mid-November (bullish background). However, they are now showing a clear lack of interest in buying aggressively at these higher prices, right below significant resistance. The trend is mature and showing signs of weakness. A trend trader should not enter a new long position directly under a major supply level with evidence of 'No Demand'. The risk of a 'false breakout' or a breakdown is elevated. The recommendation is to wait for a decisive move: a high-volume breakout above $686 would signal a continuation and a potential buy entry, while a high-volume breakdown below the ascending trendline (approx. $680) would signal a reversal and a potential sell entry. Until then, the risk/reward is unfavorable.
Declinazione di responsabilità
Le informazioni e le pubblicazioni non sono intese come, e non costituiscono, consulenza o raccomandazioni finanziarie, di investimento, di trading o di altro tipo fornite o approvate da TradingView. Per ulteriori informazioni, consultare i Termini di utilizzo.
Declinazione di responsabilità
Le informazioni e le pubblicazioni non sono intese come, e non costituiscono, consulenza o raccomandazioni finanziarie, di investimento, di trading o di altro tipo fornite o approvate da TradingView. Per ulteriori informazioni, consultare i Termini di utilizzo.