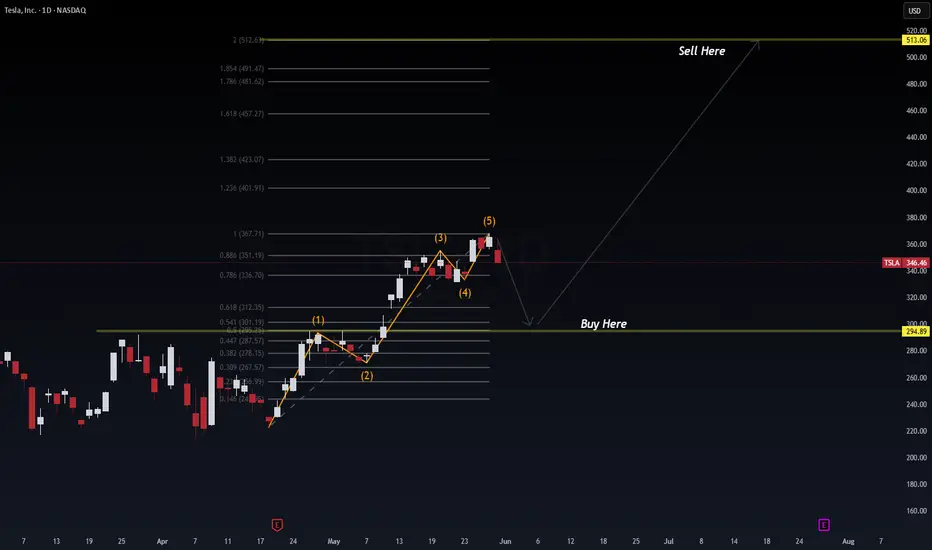
Tesla completed a textbook 5-wave Elliott impulse to the upside, topping out near the 1.0 Fibonacci extension ($367.71). We're now seeing signs of a corrective wave likely targeting the golden zone near $294.89 — aligning with SPY/NVDA retracements.
🔍 Elliott Wave Count:
Wave (1): Impulse from breakout
Wave (2): Shallow pullback
Wave (3): Extended rally
Wave (4): Minor correction
Wave (5): Final push – now failing
📉 Fibonacci Zones:
Current Price: $346.46
Wave 5 Completion: ~$367
Retracement Target: $294.89 (0.5–0.618 confluence)
Extension Target: $513.06 (2.0 extension from wave base)
📊 Probabilistic Outlook
🔻 Correction to $294.89 = 70% probability (based on wave structure + Fib retracement logic)
🔼 Rally to $513+ = 60% probability if support holds and market conditions remain risk-on
🌐 Macro Alignment (May 31, 2025)
🔄 Market rotation into value → temporary tech cooldown
📉 NVDA false breakout and SPY retracement suggest broader pullback
🧠 Tesla is a beta-multiplier to NASDAQ; expect correlation
🧭 Trade Plan:
Buy Zone: $294.89 (watch for confirmation + volume spike)
Sell Target: $513.06 (Fib 2.0 extension)
Stop: Below $278 (structure invalidation)
🧠 Pro Insight:
This is a Wave 2/4 retracement zone where institutions often reload. The broader macro pullback may present one of the last deep dips before a Q3 breakout.
#TSLA #ElliottWave #FibLevels #TechStocks #SmartMoney #SwingTrade #NASDAQ #WaverVanir #TradingView
Nota
WaverVanir ⚡ To grow and conquer
stocktwits.com/WaverVanir | wavervanir.com | buymeacoffee.com/wavervanir
Not Investment Advice
stocktwits.com/WaverVanir | wavervanir.com | buymeacoffee.com/wavervanir
Not Investment Advice
Declinazione di responsabilità
Le informazioni e le pubblicazioni non sono intese come, e non costituiscono, consulenza o raccomandazioni finanziarie, di investimento, di trading o di altro tipo fornite o approvate da TradingView. Per ulteriori informazioni, consultare i Termini di utilizzo.