🔥 Tesla Analysis (Daily Structure) 🔥
Alright, let’s break this one down 👇
🧱 Structure Overview
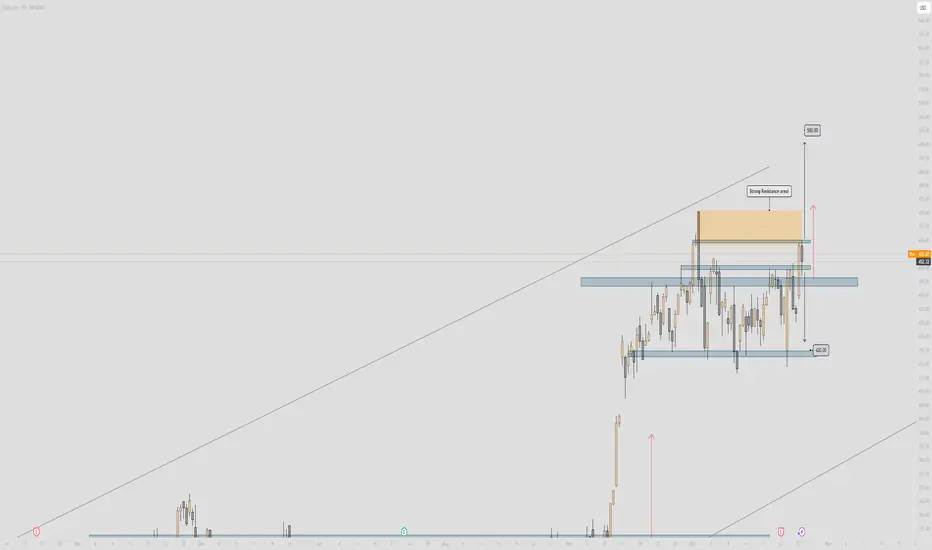
Tesla’s price is currently hovering around $452, sitting right below a major resistance zone between $455 – $470 (highlighted in orange). This area has acted as a strong ceiling multiple times — every approach has been met with rejection pressure.
Below, the support floor sits clean around $420 – $425, which has been holding the range low for a while. We’re essentially trapped in a sideways consolidation box — a range between that $420 low and the $470 resistance cap.
🧭 Bias
Current structure = Neutral to Bearish
Price just wicked into resistance, showing signs of rejection. Unless we see strong follow-through above $470 with clean volume, this is likely a reaction zone for shorts.
💡 Key Zones
Resistance (Sell Zone): $455 – $470
Strong supply — expect sellers to defend this area.
Support (Buy Zone): $420 – $425
Range demand base — liquidity resting below.
🎯 Scenarios
Bearish Setup (Higher Probability for Now)
If Tesla fails to break and close above $470, look for a move back down to $420 — possibly a liquidity grab under the range. Confirmation would be bearish engulfing or a strong rejection candle from resistance.
Bullish Setup (Breakout Play)
If price cleanly closes above $470 and retests it as support, we could open the door toward $500 (measured move target). That’d be a breakout from the range and continuation of the larger bullish channel.
⚖️ Risk Management
Bears: Stop above $475 – $480
Bulls: Stop below $445 if entering after breakout retest
Keep R:R ≥ 1:2
🧠 Summary
Tesla’s in a tight range — smart money likely accumulating or distributing near these highs. Watch for rejection signs around $470 for short plays, or confirmation above it for the next leg to $500.
This is the make-or-break zone — the next move will define Tesla’s mid-term direction. ⚡️
Alright, let’s break this one down 👇
🧱 Structure Overview
Tesla’s price is currently hovering around $452, sitting right below a major resistance zone between $455 – $470 (highlighted in orange). This area has acted as a strong ceiling multiple times — every approach has been met with rejection pressure.
Below, the support floor sits clean around $420 – $425, which has been holding the range low for a while. We’re essentially trapped in a sideways consolidation box — a range between that $420 low and the $470 resistance cap.
🧭 Bias
Current structure = Neutral to Bearish
Price just wicked into resistance, showing signs of rejection. Unless we see strong follow-through above $470 with clean volume, this is likely a reaction zone for shorts.
💡 Key Zones
Resistance (Sell Zone): $455 – $470
Strong supply — expect sellers to defend this area.
Support (Buy Zone): $420 – $425
Range demand base — liquidity resting below.
🎯 Scenarios
Bearish Setup (Higher Probability for Now)
If Tesla fails to break and close above $470, look for a move back down to $420 — possibly a liquidity grab under the range. Confirmation would be bearish engulfing or a strong rejection candle from resistance.
Bullish Setup (Breakout Play)
If price cleanly closes above $470 and retests it as support, we could open the door toward $500 (measured move target). That’d be a breakout from the range and continuation of the larger bullish channel.
⚖️ Risk Management
Bears: Stop above $475 – $480
Bulls: Stop below $445 if entering after breakout retest
Keep R:R ≥ 1:2
🧠 Summary
Tesla’s in a tight range — smart money likely accumulating or distributing near these highs. Watch for rejection signs around $470 for short plays, or confirmation above it for the next leg to $500.
This is the make-or-break zone — the next move will define Tesla’s mid-term direction. ⚡️
Declinazione di responsabilità
Le informazioni e le pubblicazioni non sono intese come, e non costituiscono, consulenza o raccomandazioni finanziarie, di investimento, di trading o di altro tipo fornite o approvate da TradingView. Per ulteriori informazioni, consultare i Termini di utilizzo.
Declinazione di responsabilità
Le informazioni e le pubblicazioni non sono intese come, e non costituiscono, consulenza o raccomandazioni finanziarie, di investimento, di trading o di altro tipo fornite o approvate da TradingView. Per ulteriori informazioni, consultare i Termini di utilizzo.