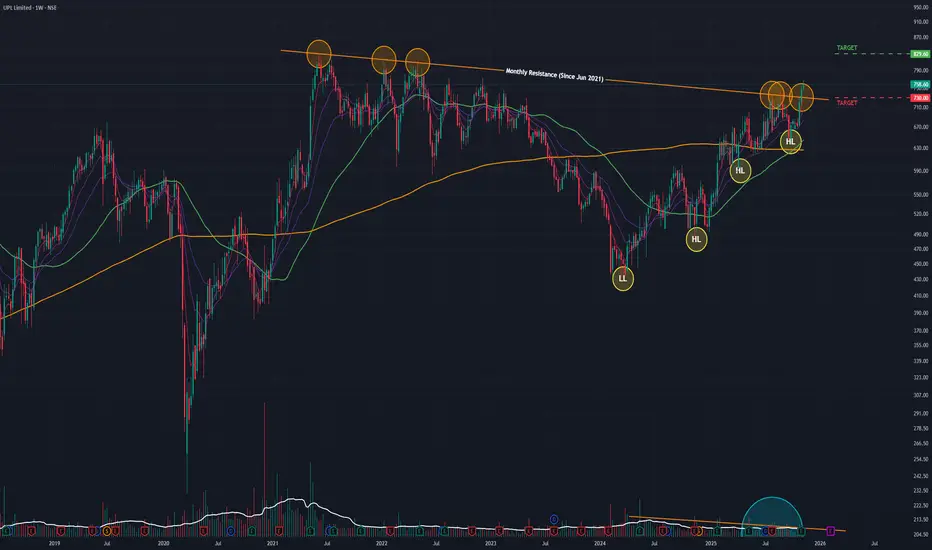
Based on Weekly Timeframe, Logarithmic Scale
This is a high-conviction breakout. The stock has decisively broken a 4.5-year angular resistance, driven by a blockbuster quarterly earnings report that confirmed a strong business turnaround. The alignment of high-timeframe indicators suggests a new long-term uptrend is beginning.
🚀 1. The Fundamental Catalyst (The "Why")
The technical breakout is not random. It is a direct response to strong Q2 2026 earnings:
- Strong Profitability: The company reported a 40% year-over-year growth in EBITDA and a net profit of ₹553 crore, a massive turnaround from the net loss reported in the same quarter last year.
- Upgraded Guidance: Management upgraded its full-year EBITDA growth guidance, signaling confidence in the business.
- Market Reaction: This news provided the "fuel" for the market to absorb supply and break the multi-year resistance.
📈 2. The Long-Term Setup (The "Big Picture")
- The 2021 Peak: After its ATH in June 2021, the stock was capped by a long-term angular resistance trendline.
- The 2024 Bottom: The stock was in a corrective downtrend, which found its ultimate bottom in March 2024.
- The Reversal: Since that low, the stock has been in a steady reversal, forming a bullish structure of Higher Lows.
- The "Lid": This recovery was repeatedly halted by the 4.5-year angular resistance, which it failed to break on previous attempts.
📊 3. The Decisive Breakout (The Past Two Weeks)
- Week of Nov 03: The stock broke out and closed above the angular resistance for the first time.
- Week of Nov 10: The stock confirmed the breakout with a gap-up open and a further 1.42% gain.
- Volume: The volume during the March 2024 uptrend was low (a "wall of worry"), but the breakout and confirmation weeks saw above-average volume (12.29 Million last week), confirming institutional interest.
🎯 4. Confluence of Indicators
Indicator analysis confirms the new long-term trend. This "trifecta" of bullishness on high timeframes is very powerful:
- EMAs: Short-term Exponential Moving Averages are in a "PCO" (Price Crossover) state on both the Monthly and Weekly charts.
- RSI: The Relative Strength Index is rising on both the Monthly and Weekly charts.
🧠 5. Short-Term Caution & Future Scenarios
- The "Inverted Hammer": The last daily candle of the week was an "inverted hammer." This is a sign of short-term indecision and profit-taking. It signals that while the breakout is valid, it's meeting immediate supply, and a healthy pullback or "re-test" is highly possible.
- Conclusion: The trend is now bullish, but the entry point is key.
🐂 The Bullish Case (Continuation)
- Trigger: The bullish momentum continues, absorbing the short-term profit-taking.
- Target: The next logical price target is ₹830.
🐻 The Pullback Case (Healthy Re-test)
- Trigger: If the "inverted hammer" plays out and momentum is lost in the short term.
- Support: The price would likely fall to re-test the angular resistance-turned-support at ₹730. A "bounce" off this level would be a classic, healthy confirmation of the breakout.
Disclaimer: This analysis is my personal view & for educational purposes only. They shall not be construed as trade or investment advice. Before making any financial decision, it is imperative that you consult with a qualified financial professional.
Declinazione di responsabilità
Le informazioni e le pubblicazioni non sono intese come, e non costituiscono, consulenza o raccomandazioni finanziarie, di investimento, di trading o di altro tipo fornite o approvate da TradingView. Per ulteriori informazioni, consultare i Termini di utilizzo.