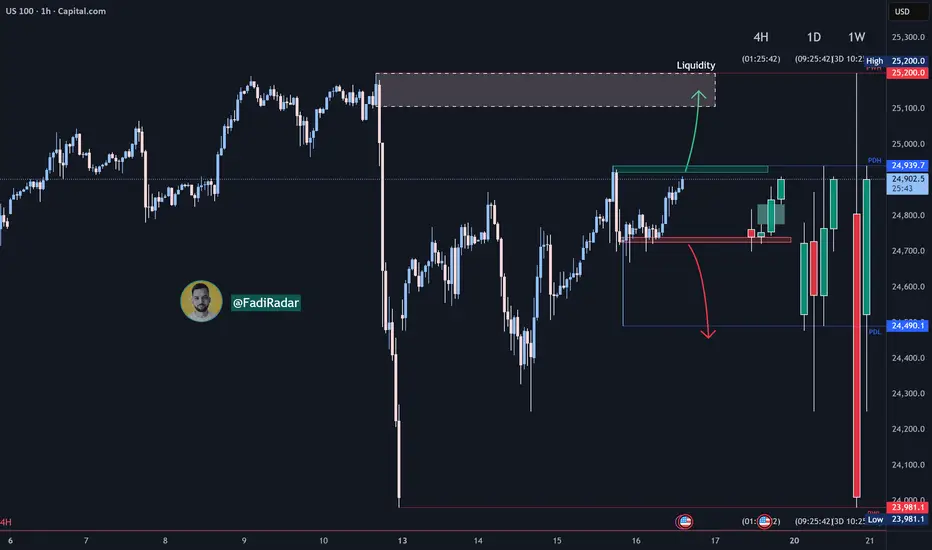
The NASDAQ index is moving in a short-term upward trend and is now approaching the 24,900 resistance zone.
🔺 Bullish Scenario:
If the price breaks above 24,900 and holds, this could support further upside movement toward the liquidity zone around 25,200.
🔻 Bearish Scenario:
If the price rejects from resistance, it may retest the 24,700 support level, and a break below it could shift the trend back to bearish.
📈 Best Buy Zones: on a rebound from 24,750 or after a confirmed breakout above 24,900
📉 Best Sell Zone: below 24,700
Declinazione di responsabilità
Le informazioni e le pubblicazioni non sono intese come, e non costituiscono, consulenza o raccomandazioni finanziarie, di investimento, di trading o di altro tipo fornite o approvate da TradingView. Per ulteriori informazioni, consultare i Termini di utilizzo.
Declinazione di responsabilità
Le informazioni e le pubblicazioni non sono intese come, e non costituiscono, consulenza o raccomandazioni finanziarie, di investimento, di trading o di altro tipo fornite o approvate da TradingView. Per ulteriori informazioni, consultare i Termini di utilizzo.