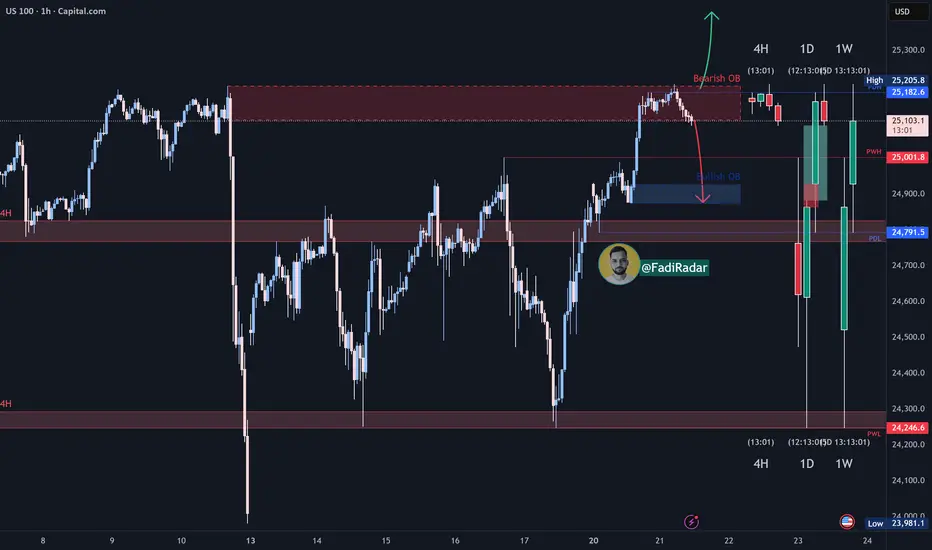
The NASDAQ index recently tested its all-time high and is now showing signs of a potential corrective pullback after a strong bullish run.
📉 Expected scenario:
The price may retrace toward the 24,900 demand zone, which serves as an important support area.
If the index bounces from this level, it could resume its upward movement to form a new high.
However, if the price breaks below 24,900 and holds, a deeper move toward 24,600 is likely.
📈 Best buy zone: On a confirmed rebound from 24,900
📍 Best sell zone: On a confirmed rebound from 25,100, or Below 24,900 after confirmation
Declinazione di responsabilità
Le informazioni e le pubblicazioni non sono intese come, e non costituiscono, consulenza o raccomandazioni finanziarie, di investimento, di trading o di altro tipo fornite o approvate da TradingView. Per ulteriori informazioni, consultare i Termini di utilizzo.
Declinazione di responsabilità
Le informazioni e le pubblicazioni non sono intese come, e non costituiscono, consulenza o raccomandazioni finanziarie, di investimento, di trading o di altro tipo fornite o approvate da TradingView. Per ulteriori informazioni, consultare i Termini di utilizzo.